Curated OER
Pick's Theorem
Students investigate polygons and their lattice. In this calculus lesson, students record data using different methods. They analyze their data and draw conclusions based on the relationship between the area and the interior lattice.
Curated OER
What's the Fizz Factor
Students as a class create a fountain using both coke soda, and mentos candy. In this science activity, students test which combination of coke and mentos products produce the tallest fountain. Students use the scientific method to track...
Curated OER
How Do We Solve the Problem of Wildlife on Our Roads?
Students analyze data on elk ecology and movements across the highway. In this ecology lesson, students research ways to save them from highway collisions. They write a report and present their findings in class.
Curated OER
1928 Flu
Students state the some diseases are the result of infection. They describe the risks associated with biological hazards, such as viruses. Pupils name ways that infectious disease can be prevented, controlled, or cured. Students...
Curated OER
Mathematics Within: Algebraic Patterns
Students discover patterns in linear equations by playing a dice game to collect data. They graph the data and analyze the patterns of the lines created by the data. The class then compares the individual graphs to evaluate the position...
Curated OER
Virtual Field Trip
Learners calculate gasoline cost per mile on a virtual field trip. They calculate the gasoline costs and travel time for each of the 2 routes, and record on a data sheet. They use Excel to create data tables for mileage, gasoline...
Curated OER
Ratios
Fourth graders complete a taste test of different sandwiches, rate them, and then put them in a ratio graph. In this ratio lesson plan, 4th graders write what they learned about ratios after this activity.
Curated OER
What's Cooking at the Good Times Cafe?
Students collect data from classmates showing their favorite lunch food. They enter their data and graph the results using a computer program.
Curated OER
Cutting Cordwood
High schoolers examine a story problem in which two men are earning money by cutting cords of wood. They use data from graphs to use on a grid. They practice writing algebraic equations as well.
Curated OER
What Does It Eat?
Students, working in research teams, investigate the eating habits of crickets. They collect and record data and compare their methods and results with other groups by making tables or graphs. They sumarize their findings with posters or...
Curated OER
Patterns In Hexagon Tables
Sixth graders construct a rule about the number of sides found in a pattern of hexagons. In this mathematical problem solving lesson, 6th graders observe different hexagon patterns and create a rule about the relationship between the...
Curated OER
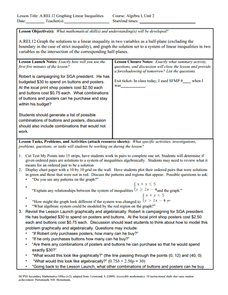
Graphing Linear Inequalities
Eighth graders extend skills for representing and solving linear equations to linear inequalities. Lesson activities build understanding and skill by plotting ordered pairs of numbers that either satisfy or do not satisfy a given...
Curated OER
Populations Lab - Exponential Graphing
Ninth graders investigate the application of populations that exists in one's everyday environment, in order to develop an understanding of how mathematics is a key component in the understanding of population dynamics.
Curated OER
Valentine's Day Math
First graders sort their candy hearts into piles according to color and record a tally mark under the color for each candy heart that they have on the worksheet. They then record the total amount of tally marks for each color of candy...
Power to Learn.com
Survey of Favorites
Upper grade and middle schoolers discuss their favorite TV programs, music, books, etc. Following a lesson on measures of central tendency, learners discuss random sampling. They conduct a survey and use charts and frequency tables to...
Curated OER
Atomic Candy
Mmmmm! Radioactive "candium!" Nuclear physics or chemistry classes use M&M'S® to demonstrate the process of radioactive decay. Individuals pour out a bag of candies and record the number that fall M-side-up to represent the number of...
Curated OER
How Do You Spend Your Time?
Pupils keep records and determine how much time they spend on certain activities. They insert the data into a spreadsheet. Students graphically display data in a bar graph and a circle graph.
Curated OER
"Favorite Fairy Tale Characters"
Third graders enter the results of their survey on a spreadsheet. They construct a bar graph showing the results.
Curated OER
Best Guesser
Fifth graders develop strategies for estimating ages, and illustrate results by graphing and interpreting scatter plots to compare x and y coordinates.
Curated OER
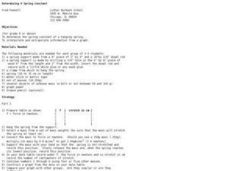
Determining A Spring Constant
Students determine a spring constant and extrapolate information from a graph. In this spring lesson plan students divide into groups and complete a lab activity.
Curated OER
Arsenic Contamination: Water Filtration
Students work in groups to design a filtration process that will separate clean water from polluted water. They organize data in tables or graphs and present their findings to the class. Students identify further safety protocols that...
Curated OER
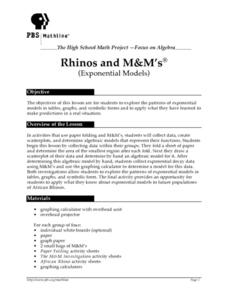
Rhinos and M&M's
Students analyze patterns of exponential models by collecting data in paper folding and M&M investigations. They use graphing calculators to create scatter plots that lead to equations for the exponential models. They then apply this...
Curated OER
Predator-Prey Simulation
High schoolers simulate a predator-prey interaction in an ecosystem. Students use different size squares cut from paper to represent predators and prey. They simulate the interactions of the species by following instructions for the...
Curated OER
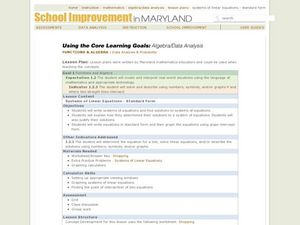
Functions & Algebra
Students examine linear equations. In this functions and algebra lesson, students write equations in the slope-intercept form. They enter data in a graphing calculator, examine tables, and write linear equations to match the data.


