Curated OER
Moon Craters Lab
Students explore characteristics of mass. For this scientific inquiry about mass lesson, students drop rocks of different weights from various heights and record the depth of the "crater" created. Students record their findings on a...
Curated OER
Graph Both Crusts
Fourth graders calculate the angles and construct a pie graph of the percentages of the elements in the continental and oceanic crusts. Then they analyze the results. They can be assigned the task of researching the percentages.
Curated OER
I'm Inclined to See; Physics, Math, Science, Experiments, Graphs
Students discover the motion of a sphere on an inclined plane and discover basic relationships involving distance, time, speed(velocity), and acceleration.
Curated OER
Strings and Springs
Ninth graders explore physics with springs and strings. In this force and motion lesson, 9th graders rotate through four stations exploring how various springs stretch and bounce, and how mass and length affect a pendulum's swing. They...
Curated OER
Get a Half-life!
Students use m&m candies as their sample set. They begin by counting the total number of candies to determine their sample size. Students put the candies into a cup and shake them gently before pouring them onto a paper plate. Count...
Curated OER
Choosing a Summer Job
What did you do over your summer vacation. Young wage earners must compare summer job options, and determine when each job earn the same amount and what that amount be. This be done by creating, graphing, and solving systems of...
Curated OER
Are Taxes "Normal?"
Students explore the concept of normal distribution. In this normal distribution lesson plan, students find the normal distribution of taxes in the 50 US states. Students make histograms, frequency tables, and find the mean and median of...
Curated OER
Water Usage and Conservation
Pupils investigate water usage at school and at home. They use graphs and tables to evaluate water usage. Students describe possible water conservation measures. They use graphs and tables to relate data as part of a written report.
Curated OER
Predator-Prey Simulation
High schoolers simulate the interactions between a predator population of lynx and a prey population of rabbits. They collect and graph the data, then extend the graph to predict the populations for several more generations.
Curated OER
Get a Half-life!
Students explore decay functions and the half-life of a substance. Through an M&M activity with calculators, students collect and graph data. They determine the linear, quadratic and exponential functions of the graph. Students...
Curated OER
The Predator-Prey Simulation
Students play a game in which they simulate the interactions between a predator, lynx, and a prey, rabbit. Students collect data on the interactions, graph data, and make predictions for populations of several more generations.
Curated OER
Harry Potter Research Project
Young scholars work together to complete a research project on Harry Potter. They write a research question and develop a survey to give to their classmates. Using the results, they create a graph and draw conclusions about the data...
Curated OER
Sunspot Activity
In this space science worksheet, students find the data that is needed to help them acquire the knowledge concerning sunspots through observation and data collection.
Curated OER
Canada's Immigration patterns: 1950 to Present
Students examine the changing immigration pattern of Canada. In this immigration lesson, students use statistical data from a web-site to complete a worksheet and graph their findings.
Curated OER
Jelly Belly: What a Wonderful "Bean"!
Students explore how jelly beans are produced. They discuss the origins of the jelly bean and view a video about how jelly beans are prepared, tested, shaped, finished, and shipped and estimate the amount of jelly beans in a jar and sort...
Curated OER
Education for Global Peace
Students survey the class and graph the results. In this graphing and data collection lesson, students conduct a survey to see where their shirts were produced. Individuals use software to graph the results and create a written...
Curated OER
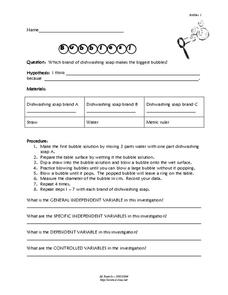
Bubbles
Young scholars experiment bubbles. In this scientific method lesson, students identify variables used in proper experiment design. Young scholars conduct experiments with different brands of dish-washing detergent to determine which...
Curated OER
Putting Your Best Foot Forward
Third graders measure their feet and their parents' feet, record data on computer-generated graphs, and calculate and record mean, median, and mode.
Curated OER
Bodacious Buttons
First graders graph a data set. Given a set of buttons, 1st graders sort them into categories using specific attributes. They graph the number of buttons in their set based on their attributes using a variety of graphs. Students share...
Curated OER
Statistics Newscast in Math Class
Students study sports teams, gather data about the teams, and create a newscast about their data. In this sports analysis instructional activity, students research two teams and define their statistical data. Students compare the two...
Curated OER
The Coyote Population: Kansas Prairies
Students discover animal lifestyles by researching their ecosystem. In this animal statistics lesson, students research the geography of Kansas and discuss the reasons why wild animals survive in the open Kansas fields. Students complete...
Curated OER
Move It
Studens collect and graph data. In this algebra lesson plan, students use a CBL and CBR with a TI Calcualtor to observe linear graphs. They use the correct vocabualry as they discuss the collected data.
Curated OER
Box Plots
Students review the concept of median, explore how to calculate quartiles for any size data set and experience how to build a box plot.
Curated OER
Experimenting with Pressure and Volume
Students investigate temperature and pressure with simple laboratory equipment. They use a handheld with sensors and probes to study temperature and pressure. Students explore the nature of gases with respect to temperature and are able...


