Curated OER
Buoyant Boats
Fourth graders explore the concept of mass and buoyancy. After building boats out of several materials, they predict whether each boat floats if certain objects are added. Students test their predictions and draw conclusions from their...
UT Southwestern
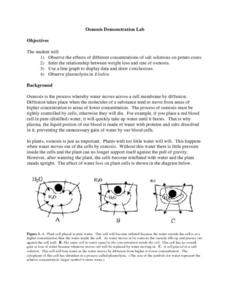
Osmosis Demonstration Lab
Even though they were written for upper-level high schoolers or college pupils, the labs herein are possible to use even in middle school. In the activity, kids observe osmosis in both potatoes and elodea plants, then record and graph...
Curated OER
Laws of Motions
Seventh graders explore the Laws of Motion. They define friction and explain the concept of inertia. Students explain what happens when a force is exerted on an object that is in equilibrium. They state the second and third laws of motion.
Curated OER
Yeast Cells and their Environment
Students study the scientific method and explore how to design an experiment. In this investigative lesson students explore and hypothesis an experiment then carry it out to find the results.
Curated OER
Jumping Frogs - A Lesson on The Scientific Method
Students use origami frogs to experience the scientific method. They define different scientific terms. Also they test a hypothesis and draw conclusions from observations to go through all the steps of the scientific method.
Curated OER
Investigating the Response of Worms to Soil Improvers
The worms crawl in, the worms crawl out, but do they care what soil is all about? Find out in an easy and fun controlled experiment. Have your young biologists hypothesize, test, and draw conclusions about which type of soil worms...
Curated OER
First You Take an Ecumene
Although this was written regarding Canadian agriculture, it can be used in any agriculture or environmental science class. Learners evaluate agricultural and economic activity maps and consider land use competition. Activities that get...
Curated OER
Breakfast Cereal - How Nutritious Is Yours?
Students analyze the nutritional value of breakfast cereal in order to make an informed choice. They create a stem and leaf plot which analyzes the nutritional value of the cereal they eat on a regular basis. Students write a letter to...
Curated OER
The Beat of Your Heart
Students explore different applications involving their own heart. In this illumination lesson students measure their fists and relate it to the dimensions of their hearts.
Curated OER
Tracks are for Trains
Second graders collect data on different forms of transportation and create a bar graph or pictograph with the information.
Curated OER
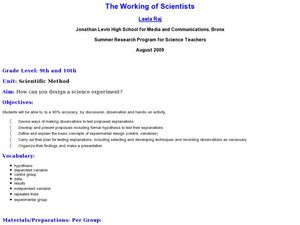
The Working of Scientists
Students define and explain the basic concepts of experimental design. In this scientific method lesson plan students complete a hands on activity, develop and present proposals to test their explanations.
Curated OER
Matchstick Math: Using Manipulatives to Model Linear, Quadratic, and Exponential Functions
Playing with matches (unlit, of course) becomes an engaging learning experience in this fun instructional unit. Teach pupils how to apply properties of exponential functions to solve problems. They differentiate between quadratic and...
Curated OER
Modeling Linear Relationships
Students graph lines using the slope and y-intercept. In this algebra lesson, students create data using tables and equations. They use their data to make predictions and draw conclusion.
Curated OER
Scientific Research
Students examine the process of scientific inquiry. They develop twenty questions, categorize the questions, develop a research proposal, analyze data, draw conclusions, and explain how their research connects to the state standards.
Curated OER
The Big Hand Challenge
Students utilize a computer spreadsheet to record and analyze data. In this problem solving lesson, students compare their hand size to that of the principal. Students understand standard and nonstandard measurement.
Rochester Institute of Technology
Hazmat Disposal
What a waste! The last installment of a nine-part technology/engineering series teaches learners about medical waste disposal systems. Conducting a simulation allows individuals to understand how monetary considerations constrain waste...
Curated OER
The Probability Scale
Students collect data and make predictions. In this probability lesson, students perform experiments calculating the chance of an event occurring. They draw conclusion based on their data.
Curated OER
Draw your Conclusions
Students analyze data from a student discussion website and write a report on the outcome of an investigation regarding their local water quality. As part of a larger unit students then post the summary of their investigation on the...
Foundation for Water & Energy Education
How is Flowing Water an Energy Source? Activity A
Here is a fun little exploration of the potential energy potential of falling water. Learners drop water from various heights using a straw, and they analyze the diameter of the splash. Pair this with two more activities of the same...
Foundation for Water & Energy Education
How is Flowing Water an Energy Source? Activity B
Explore the world's water without leaving the classroom! In this second of three uncomplicated but wonderful activities, physical science learners feel the pressure of water. They discover that the deeper the water, the stronger the...
Curated OER
SUNSPOTS SPOTTED
Students study sunspots and their motion, from data gathered, they determine the significance of the sunspot data. The data be used to calculate the rotational period of the sun. They draw conclusions as to the sunspot's impact on the...
Curated OER
How Oceans Affect Climate
Learners draw conclusions about how the ocean affects temperature. In this weather lesson, students use the Internet to gather data to help them come to a conclusion about how the climate in a certain region is directly affected by the...
Curated OER
Population Pyramids
Students utilize population pyramids to answer questions, make comparisons, draw conclusions and support predictions about the populations of China, India and the Unites States. They arrange numbers and symbolic information from various...
Curated OER
Global Warming Statistics
Learners research real-time and historic temperature data of U.S. and world locations, and analyze the data using mean, median, and mode averages. They graph the data and draw conclusions by analyzing the data. A spreadsheet is used to...


