Curated OER
The Letter "L"
Students practice using the letter "L." In this letter "L" lesson plan, students complete a worksheet (not included) on which they identify pictures of items that begin with the letter "L."
Curated OER
Introduction to Graphical Representation of Data Sets in Connection with Nuclear Decay
Students record data, make observations, and share in experimentation and discussion of numerical experiments.
Curated OER
Discovery
Students explore patterns in number problems. They devise a strategy to solve a number problem. Students estimate and calculate answers, making efficient use of a calculator, where appropriate, as part of solving a problem. They...
Curated OER
Big Steps
Second graders practice developing strategies for mental calculation when counting in 10s and 100s. They mentally perform calculations involving addition and subtraction to be able to state the difference between numbers by counting in...
Curated OER
Collecting, organizing and comparing data for cellular telephone buying and calculating average, and median price and best deal per cost.
Students research data and develop statistical methods such as mean and median price and make convincing arguments as powerful ways for decision making.
Curated OER
A Teeny Tiny Book: My Friends
In this mini book worksheet, students cut apart and complete a teeny tiny book with names of friends and their phone numbers.
Curated OER
A Number a Day
Students explore the calendar including sequence of the days of the week, and the numbers associated with each day. They conduct research about each number and share what they find with the class.
Curated OER
Geography: Snow Cover on the Continents
Young scholars create maps of snow cover for each continent by conducting Internet research. After estimating the percentage of continental snow cover, they present their findings in letters, brochures or Powerpoint presentations.
Curated OER
Functions and Graphs -- Pattern Detection #1
Students discuss the job of an archaeologist by determining how people have used their environment. Using a graph, they analyze the patterns and functions of Native Americans in Arizona using maize. They work together to answer...
Curated OER
Average Looking
Students use measurements of their classmates to find the average (means and modes) of their facial features. They use their findings to create a three-dimensional "class head." Examples and assessment materials are included.
Curated OER
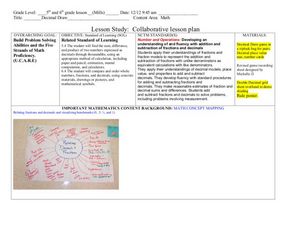
Decimals: Collaborative Lesson
Students explore mathematics by participating in a group activity. In this number value lesson, students identify the uses for decimals and how to best estimate whole numbers based on decimals and fractions. Students collaborate with...
Curated OER
Parks Design Project
Learners explore two dimensional geometric figures. They explore the relationships and measurements of geometric figures. Students apply proportion and scaling. They design a city park for learners and teenagers.
Curated OER
Probability Review
High schoolers engage in a lesson that is concerned with the concepts related to probability. They review the key properties of statistics involved in the measurement of probability that includes mean, median, and mode. The lesson...
Curated OER
Data Collection Project
Students collect data using email. They calculate the mean, median, mode, range and outliers. They create a graph using the data results. They write five paragraphs to summarize their data.
Curated OER
Fractions
In this mathematics worksheet, students read, write, order and compare fractions and mixed numbers. They identify that there are various strategies for finding fractional parts and use fractions to order and compare amounts or quantities.
Curated OER
The Case of the Mysterious Red Light
Students investigate why some sunrises and sunsets are unusually bright red.
Curated OER
How Fast Is that Rocket?
Eighth graders calculate the speed of a falling object using measurements from a falling rocket. They report data from their data sheet to the teacher to record on the board or on the overhead transparency and discuss the results with...
Curated OER
Trigonometry
Eighth graders practice calculating the unknown length of a right angle triangle. They also examine the pythogoram theory in groups. They help each other work through the problems.
Curated OER
"Checking In"
Students examine the checkpoints along the Iditarod Trail. They calculate the distances, mean and medians between each checkpoint. Using the internet, they follow along a virtual trail. They answer questions about when it would be more...
Curated OER
Musher Graphing and Probability
Students use the internet to research statistical information on the musher dogs participating in the Iditarod. Using the data, they create three different types of pie charts. They use the charts to answer questions about the dogs. They...
Curated OER
A Picture is Worth a Thousand Words
Sixth graders work to write questions for a class survey. In this survey lesson, 6th graders survey their class members by asking the 4 questions they developed and will record their answers on the culminating assessment...
Curated OER
Your Just Desserts
Young scholars write letters to town officials and local businesses asking for favorite dessert recipes. They tabulate their responses in a spreadsheet. Students turn their survey results into colorful graphs.
Curated OER
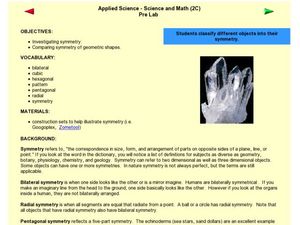
Symmetry
Sixth graders explore symmetry and discuss the difference between a rotation and reflection. Using hands-on activities, such as folding paper shapes, they discover how to find the lines of symmetry and symmetrical characteristics. As a...
Curated OER
Angle Benchmarks
Sixth graders discuss the characteristics of specific angles and then use the information to to identify and estimate given angles. The class goes outside, identifies north, and turns a specified amount of degrees. Using a given compass,...


