Curated OER
Elements, Compounds, and Mixtures
In this elements, compounds, and mixtures worksheet, learners answer questions about the properties of elements, mixtures, and compounds. Students identify the physical changes that is made to a substance to determine if it is an element.
Virginia Department of Education
States and Forms of Energy
Energy is just energy, right? Explain various forms of energy to your young scientists by using an interactive experiment that contains common objects to demonstrate complex concepts. Pupils conduct experiments for radiant, thermal,...
Teach Engineering
Rock and Boat
Present the class with a question on whether the water level of a pond will rise they take a large rock out of a boat and drop it into the pond. Groups come down on all sides of the question and try to justify their answers. The activity...
Royal Society of Chemistry
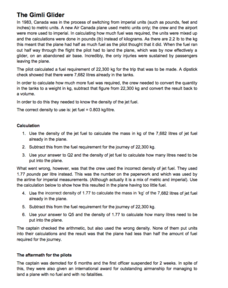
Gimli Glider—Anecdotes for Chemistry Teachers
What's the moral of this story? Units save lives! Teach measurement conversion through storytelling in a quick math-based lesson. Young scientists learn how one country's decision to swap from imperial to metric standard units caused an...
Virginia Department of Education
Heat and Thermal Energy Transfer
How does radiation affect our daily lives? Answer that question and others with a lesson that discusses radiation and its use in thermal energy transfer through electromagnetic waves. Pupils investigate vaporization and...
Curated OER
The Mole
High schoolers investigate moles and Avogadro's hypothesis. In this moles lesson plan, students complete a worksheet by finding the volume of 1 mole of each substance given its density and they find the number of molecules, the formula,...
Curated OER
Changes in the Copper Penny
Third graders explore the difference between a physical change in a substance and a chemical change. students study the volume, density, altering shape and chemistry of a copper penny.
Curated OER
I've Got That Sinking Feeling
Students design a simple boat and predict how much weight it can carry. They should also discover why objects float or sink and how this can be determined experimentally. A great lesson on buoyancy!
Curated OER
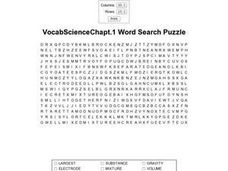
Vocab Science Chapter 1
In this word search instructional activity, students locate 20 words related to science. The word list includes volume, mixture, and solute.
Curated OER
Creating the Ideal Cargo Boat
Students build boats out of clay to test the buoyancy of the boat in water. Students break into pairs and construct their boat to specific guide lines, then experiment with their boat in the water.
Curated OER
Float My Boat
Fourth graders, in groups, experiment with density and the displacement of water by creating and designing their own boats and seeing which boat holds the most centimeter cubes without sinking..
Virginia Department of Education
The Particle Theory of Matter
Demonstrate the particle theory of matter to high school scientists with an engaging experiment that allows them to visually see the results as substances change from one state to another. The class concludes with a discussion about how...
Virginia Department of Education
The Rate of Motion
How much time does it take to jump over three balloons? Pupils calculate the speed of tasks that require different motions. They determine motions for tasks such as walking, skipping, hopping, and jumping before creating a...
Virginia Department of Education
Work and Power
Assist your class with correctly calculating the values for force, work, and power as they determine the amount various activities require. They gather data and participate in a group discussion to compare results upon conclusion of the...
Curated OER
"Graphing Your Motion"
Students study the concepts of motion, velocity, and acceleration through graphing their own movement using LoggerPro. They explain the difference between speed and velocity using the weather vane example. They discover the difference...
Curated OER
Chemistry Review
In this chemistry review worksheet, students identify chemical changes, isotopes, ions, and chemical bonds. This worksheet has 32 multiple choice questions.
Curated OER
Comparison of Snow Cover on Different Continents
Young scholars use the Live Access Server (LAS) to form maps and a numerical text file of snow cover for each continent on a particular date. They analyze the data for each map and corresponding text file to determine an estimate of snow...
Curated OER
Aruba Cloud Cover Measured by Satellite
Students analyze cloud cover and to compose written conclusions to a given related scenario. They submit a letter of response and a report detailing their calculations and conclusions.
Curated OER
Third Grade Science Multiple Choice Practice
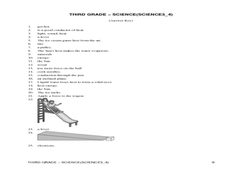
In this 3rd grade science worksheet, 3rd graders complete a total of 25 multiple choice questions related to grade 3 concepts. An answer key is given.
Curated OER
What is Matter?
Students investigate what matter is and how it changes states. In this physical properties lesson, students examine the vocabulary database and identify the characteristics of the three phases of matter. Students perform a...
Curated OER
Force and Motion
Students experiment with force and motion. In this force and motion lesson, students test gravity using a variety of objects. Students rotate through a series of stations which use force, motion, friction, and inclines. Students predict...
Curated OER
Matter: Solids Liquids and Gases
Young scholars participate in a science experiment to understand that matter takes up space. For this matter lesson, students experiment with solids, liquids and gases to recognize that matter is everywhere. Young scholars make...
Curated OER
Graphing Your Motion-Day 1
Ninth graders explore the concepts of motion, velocity and acceleration through graphing their own movement using LoggerPro. They become more familiar with the computer technology. Students explore graphing in real time and graph on...
Curated OER
Snow Cover By Latitude
Students examine computerized data maps in order to create graphs of the amount of snowfall found at certain latitudes by date. Then they compare the graphs and the data they represent. Students present an analysis of the graphs.


