Virginia Department of Education
Calculating Measures of Dispersion
Double the fun — calculate two measures of deviation. The lesson plan provides information to lead the class through the process of calculating the mean absolute deviation and the standard deviation of a data set. After learning how to...
Virginia Department of Education
Box-and-Whisker Plots
The teacher demonstrates how to use a graphing calculator to create box-and-whisker plots and identify critical points. Small groups then create their own plots and analyze them and finish by comparing different sets of data using box...
Virginia Department of Education
Line of Best Fit
Pupils work through a guided activity on fitting a linear equation to a set of data by entering the data into a calculator and trying to envision a line of best fit. They then have the calculator determine the least-squares line and...
Virginia Department of Education
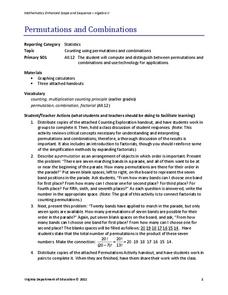
Permutations and Combinations
Counting is not all it adds up to be — sometimes it involves multiplying. The lesson introduces permutations and combinations as ways of counting, depending upon whether order is important. Pupils learn about factorials and the formulas...
Virginia Department of Education
Graphs
Examine different types of graphs as a means for analyzing data. Math scholars identify the type of graph from a series of data displays and then develop questions to match each one. Then, given a scatter plot of height versus age data,...
Virginia Department of Education
z-Scores
Just how far away from the mean is the data point? Pupils calculate the standard deviation for a set of data and find out how many standard deviations a point is away from the mean. The teacher leads a discussion on how to calculate...
Virginia Department of Education
Transformations
Geometry in life-sized dimensions! Using enlarged graph paper, pupils perform a series of transformations. By recording the initial and final placement of the images, they are able to analyze the patterns in the coordinates during a...
Virginia Department of Education
Pythagorean Theorem
Investigate the meaning of the Pythagorean Theorem through modeling. After comparing the area of the square of each side, individuals cut triangles and squares to facilitate the comparison.
Virginia Department of Education
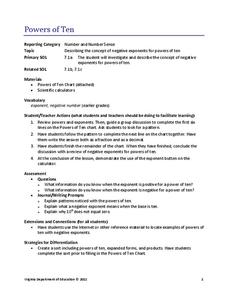
Powers of Ten
Investigate negative exponents of-ten. Pupils use the pattern of increasing powers of 10 to determine negative powers of 10. The scholars write the powers in expanded and product forms and make the connection to exponents using a...
Virginia Department of Education
Quadrilateral Sort
If only you had a Sorting Hat to sort out quadrilaterals. Learners sort cutouts of quadrilaterals based on their properties and attributes. A flowchart helps them organize the results of the activity.
Virginia Department of Education
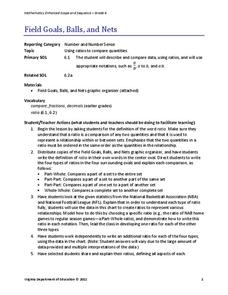
Field Goals, Balls, and Nets
Score a resource on ratios. Young mathematicians learn about different ways to express ratios. Using sports data, they write statements about the statistics in ratio form.
Virginia Department of Education
Arithmetic and Geometric Sequences
Future mathematicians learn about arithmetic and geometric sequences, as well as common ratios and differences as they complete a worksheet matching sequences with the algebraic expressions that represent them.
Virginia Department of Education
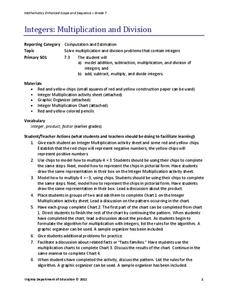
Integers: Multiplication and Division
Rules are meant to be broken ... but not integer multiplication and division rules. Learners use chips to model integer multiplication and division. The results of the activity help them develop integer rules for these operations.
Virginia Department of Education
Similar Figures
How similar do figures have to be to be similar figures? Individuals learn to identify similar figures by verifying that angles are congruent and sides are proportional. Additionally, they match the corresponding parts of similar figures.
Virginia Department of Education
Perfecting Squares
Here's a perfect way to introduce perfect squares. Individuals color in the diagonals of squares and record observations about patterns. They connect their diagrams to exponents of two and perfect squares.
Virginia Department of Education
Going the Distance
Estimate the value of one of the most famous irrational numbers. The hands-on lesson plan instructs classmates to measure the circumference and diameters of circles using yarn. The ratio of these quantities defines pi.
Virginia Department of Education
Out of the Box
There's no need to think outside the box for this one! Scholars measure the length, width, and height of various boxes. Results help develop the formulas for the surface area and volume of rectangular prisms.
Virginia Department of Education
What's the Point?
Point your class in the right direction in plotting points with three activities that give scholars a chance to learn about and practice plotting points on a coordinate plane. They draw figures on the coordinate plane and list out the...
Virginia Department of Education
Side to Side
Congruent figures: two figures that want to be just like each other. Individuals learn to distinguish between figures that are congruent and those that are not. Measuring the lengths of line segments and angles helps in this endeavor.
Virginia Department of Education
Exploring Quadrilaterals
Sort this resource into the Use pile. Scholars investigate attributes of quadrilaterals and then use the results to sort and classify the shapes labeling each figure with their properties to justify the classifications.
Virginia Department of Education
May I Have Fries with That?
Not all pie graphs are about pies. The class conducts a survey on favorite fast food categories in a lesson on data representation. Pupils use the results to create a circle graph.
Virginia Department of Education
Balancing Act
How many different interpretations of the mean are there? Scholars place numbers on a number line and determine the mean. They interpret the mean as the average value and as the balance point.
Virginia Department of Education
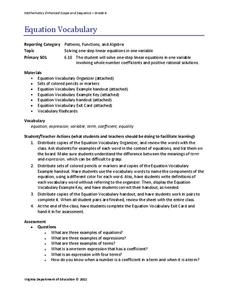
Equation Vocabulary
You'd feel bad if someone called you by the wrong name — and equations are no different. Young mathematicians learn the vocabulary associated with equations and expressions identifying these components in sample equations.
Virginia Department of Education
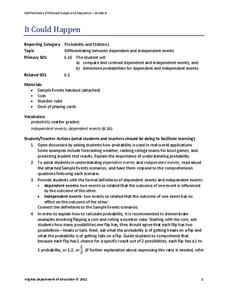
It Could Happen
Understanding of probability will probably increase with the use of a refined resource. Pupils learn to distinguish between dependent and independent events as they calculate the probabilities of these types of events in various situations.


