Curated OER
Is there Treasure in Trash?
More people, more garbage! Young environmentalists graph population growth against the amount of garbage generated per year and find a linear model that best fits the data. This is an older resource that could benefit from more recent...
Curated OER
Scientific Method Unit: Bacteria
Young scholars discover how to apply the steps of the inquiry process through the study of bacteria. Working in groups of four, they cooperatively read an article about bacteria and complete a graphic organizer. Group members share with...
Curated OER
Drug Sales Soar - Rate of Change
For this prescription drug worksheet, students answer short answer questions and create graphs on the sales of prescription drugs over a five year span. Students complete six questions.
Illustrative Mathematics
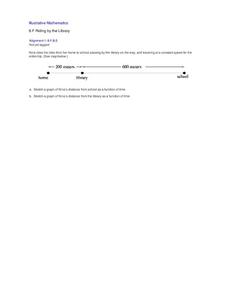
Riding by the Library
Draw a graph that shows the qualitative features of a function that has been described verbally. Make sure learners understand where time is zero and the distance is zero. It may take them some time to understand this concept, so working...
Curated OER
Water Quality: Water Filtration
Young scholars build a water filtration system. For this water quality lesson, students work in groups to construct water filtration units that can purify contaminated water. This lesson is part of a larger unit on water quality.
Curated OER
Water filtration with Plants
Sixth graders explain how soil and plants effect contaminated water in nature. In this filtration lesson, 6th graders work in groups to test biofiltration units. Students determine which biofiltration units work best and how they can...
Curated OER
A “Scientific” Approach to Buying a Car
Students examine what it takes to purchase a car and the resources out there to help find what you are looking for. In this scientific method instructional activity students complete different problem solving situations.
Curated OER
Make a Pass at Me
Students identify different types of functions and units of measurements. In this statistics lesson, students will collect data, graph their data and make predictions about their data. They plot a linear regression graph.
Curated OER
Graphing Speed; Slope
In this graphing speed worksheet, students find the slope in a position vs. time graph to be the speed. They are given example graphs of position vs. time to show the changes in slope reflect the changes in speed. Students match terms...
Curated OER
Endothermic and Exothermic Lab
In this endothermic and exothermic reactions worksheet, students experiment with water and a salt of choice to determine if heat is absorbed or released in the reaction. Students take the temperature of their solution over a 2 minute...
Curated OER
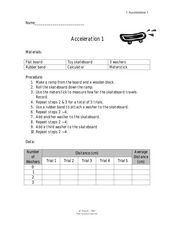
Acceleration 1
In this acceleration worksheet, students use weights to increase the mass affecting the force on moving objects. Students plot a graph of their data and answer 3 questions about how the acceleration of the toy skateboard used in the...
Curated OER
Volume of Gas
Eighth graders investigate the effect of temperature on the volume of a gas in a closed container. They measure the height of the water in their beaker/container, conduct their experiment, and create a graph to illustrate their data.
Curated OER
Graphing Linear Motion
In this graphing linear motion worksheet, learners answer 20 questions about velocity of objects, the distance they travel and the time. They interpret a graph of position vs. time and identify the velocity at certain point on the graph.
Curated OER
Ziplock Chemistry
Students investigate various chemical reactions when creating mixtures in ziplock baggies. In this chemistry lesson, students will recognize various chemical reactions and cite evidence. Safety and assessment strategies are included in...
Curated OER
Making a Line Graph
In this line graph worksheet, students use data given in a table and assign axes, make a scale, plot data and make a line or curve on their constructed graphs.
Curated OER
Nature of Science and Measurement Review
In this nature of science and measurement learning exercise, high schoolers answer 30 questions about experimental design, pure science vs. applied science, density, metric conversions and dimensional analysis.
Curated OER
Designing An Investigation
Students will design a scientific investigation. In this engineering design instructional activity, students will set up an investigation, collect data and form a conclusion about bridge design. They will use common household items to...
Curated OER
Using the Scientific Method
In this scientific method activity, students click on the links in the questions about the scientific method to find the answers to the questions and then come back and answer the questions. Students answer 12 questions total.
Curated OER
Experimenting With Motion
In this motion worksheet, students design an experiment to investigate motion. They form a question, they develop a hypothesis, they design an experiment and then answer 4 questions about their experiment.
Curated OER
The Ant and The Turntable-Frames of Reference
In this frames of reference worksheet, students solve 5 problems given the details of a journey an ant takes from the center of a CD ROM to its edge. Students draw a scaled sketch of the turntable showing the motion of the ant from...
Curated OER
How Much Energy is Stored in Wood?
For this energy lesson, students create calorimeters out of soda cans and use them to calculate the amount of energy stored in different types of wood.
Curated OER
Introduction to Functions
Learners explore functions, function rules, and data tables. They explore terms of linear functions. Students use computers to analyze the functions. Learners write short sentences to explain data tables and simple algebraic expressions.
Curated OER
Force & Acceleration
Students investigate the effects of weights on the motion of a toy car. In this force and acceleration lesson plan, students use different weights, a toy car, a paper clip and string to determine how a car will move as different weights...
Curated OER
Moving Bodies
In this moving bodies worksheet, students investigate how the amount of mass of a body in motion affects its tendency to remain in motion. Students use a meter stick as a ramp, marbles, string and a wooden block to determine how far a...


