Texas Instruments
Texas Instruments: Linear Relationship Between Weight and Quality
Students use a Force Sensor to collect weight versus number data for a collection of identical pennies and model the data using a linear equation. They will then interpret the slope as it relates to independent and dependent variables.
Illustrative Mathematics
Illustrative Mathematics: 8.f Riding by the Library
In this task, 8th graders draw the graphs of two functions from verbal descriptions. Both functions describe the same situation but changing the viewpoint of the observer changes where the function has output value zero. This forces the...
Alabama Learning Exchange
Alex: The Pattern of Graphing Linear Equations
The students will extend the knowledge of algebraic expressions from geometric representations and ultimately graph linear equations with understanding. The students will also develop a better understanding of algebraic expressions by...
CK-12 Foundation
Ck 12: Algebra: Consistent and Inconsistent Linear Systems
[Free Registration/Login may be required to access all resource tools.] Identify a system as inconsistent, consistent, or dependent and determine how many solutions a system has.
Government of Alberta
Learn Alberta: Linear Systems Graph
Learn Alberta helps students visually explore various solutions of systems of two linear equations by allowing students to manipulate lines and view their numeric and graphic solution(s) or absence. The applet identifies the solutions as...
BSCS Science Learning
Bscs: Asking and Answering Questions With Data
This inquiry is intended to provide students with practice developing investigable questions that need data, and specifically large datasets, to be answered. Click the teacher resources link for teaching guides and student handouts.
Other
Stat Soft: Statistics Glossary
Dozens of statistical terms are defined and illustrated in this glossary.
CK-12 Foundation
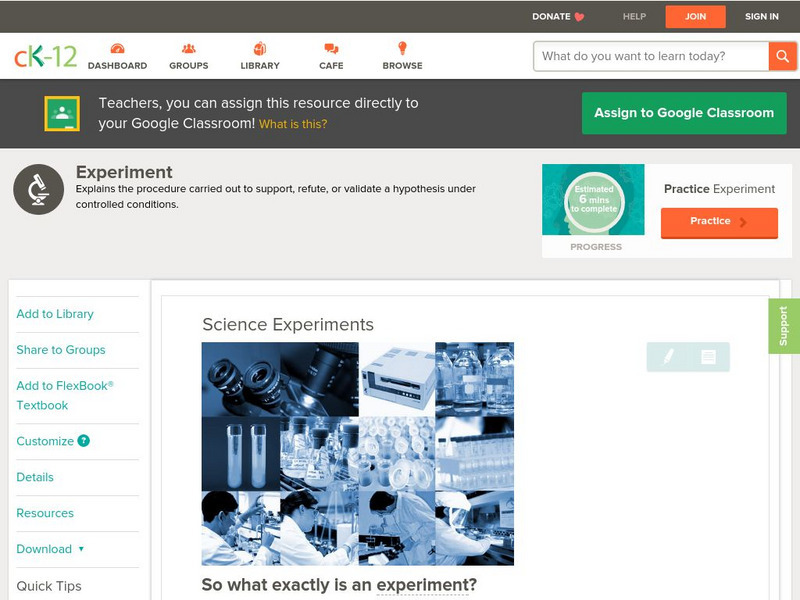
Ck 12: Biology: Science Experiments
[Free Registration/Login may be required to access all resource tools.] Introduction to scientific experiments.
Texas Instruments
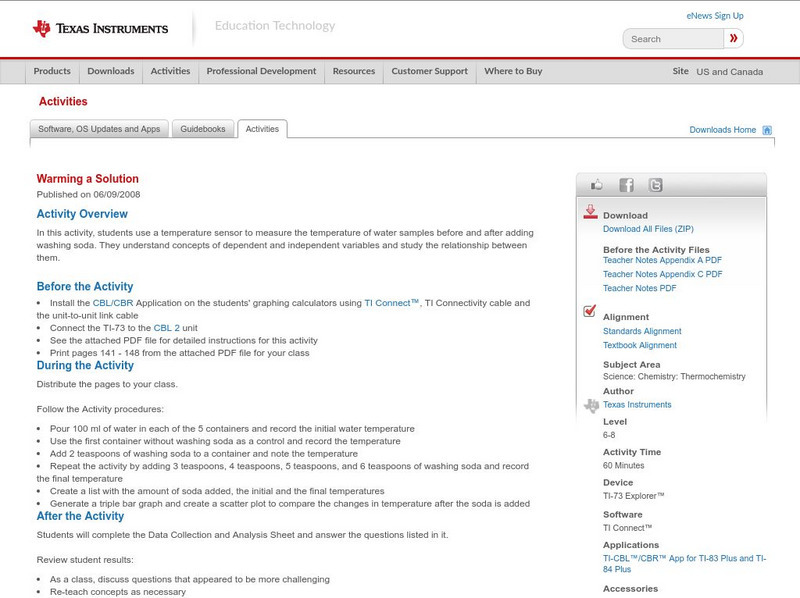
Texas Instruments: Warming a Solution
In this activity, students use a temperature sensor to measure the temperature of water samples before and after adding washing soda. They understand concepts of dependent and independent variables and study the relationship between them.
Texas Instruments
Texas Instruments: Bungee Jumper
Teacher will simulate a Bungee Jumper and have students predict when a Jumper would hit the ground.
Science Education Resource Center at Carleton College
Serc: Investigating Local Stream Discharge
This activity's purpose is to introduce hydrology to eighth grade middle schoolers by investigating stream discharge of a local stream. The students will make observations about the stream, determine the velocity and discharge of the...
Northeast Parallel Architectures Center, Syracuse University
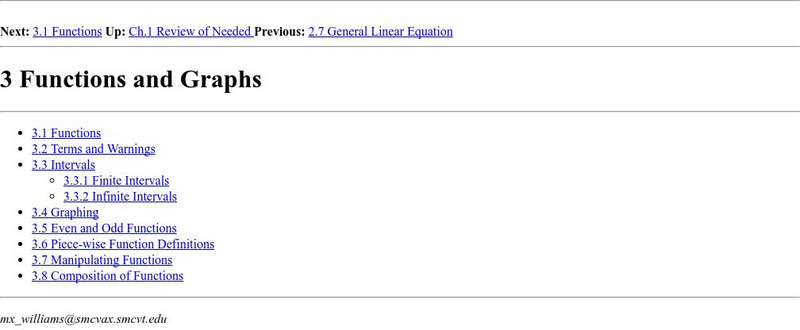
Npac Reu Program: Functions and Graphs
This site from the Northeast Parallel Architectures Center, Syracuse University contains a college level treatment of functions and graphs. Function, element, domain, range, piece-wise functions?? Stuff you know, stuff that's new. Very...
Other
Linear Functions, Slope and Regressions
Find activities here for linear functions, slopes and regression lines. Use them for classroom work or individual assignments.
CK-12 Foundation
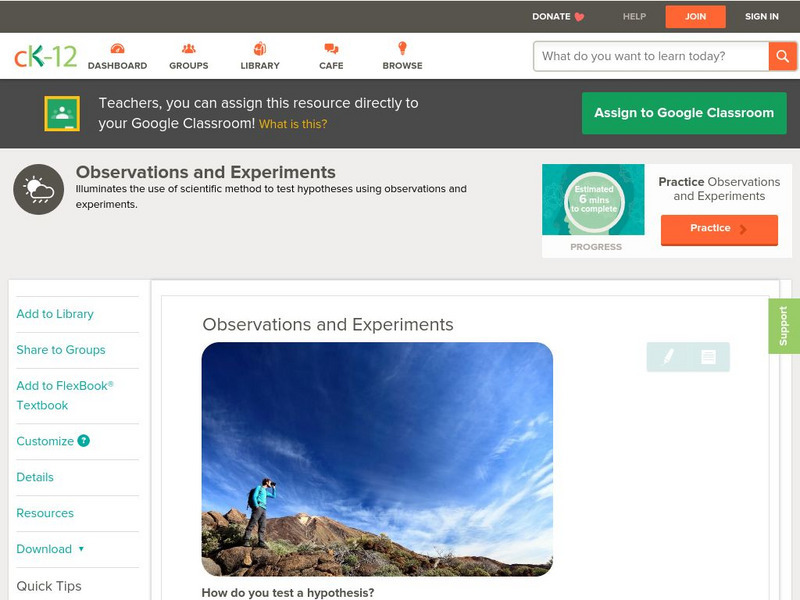
Ck 12: Earth Science: Observations and Experiments
[Free Registration/Login may be required to access all resource tools.] Using observations and scientific experiments to test hypotheses.
CPALMS
Florida State University Cpalms: Florida Students: Tracking Distance Over Time
Using turtle migration to find the relationship when measuring distance over time.
CK-12 Foundation
Ck 12: Algebra: Determining the Equation of a Line
[Free Registration/Login may be required to access all resource tools.] No description available here...
Texas Education Agency
Texas Gateway: Finding Specific Function Values (Verbal/symbolic)
Given a verbal and symbolic representations of a function, the student will find specific function values.
CK-12 Foundation
Ck 12: Earth Science: Observations and Experiments
[Free Registration/Login may be required to access all resource tools.] Using observations and scientific experiments to test hypotheses.
CK-12 Foundation
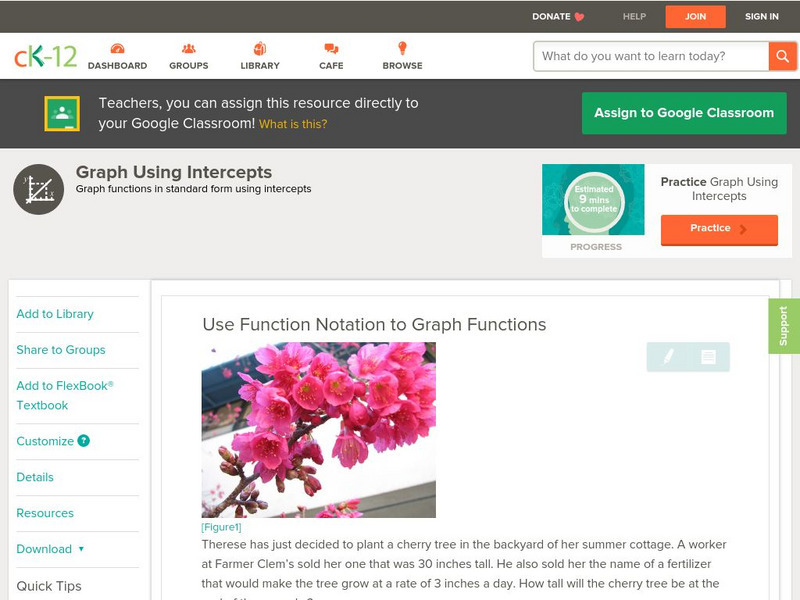
Ck 12: Algebra: Graphs of Linear Functions
[Free Registration/Login may be required to access all resource tools.] Students learn to use function notation to graph functions. Students examine guided notes, review guided practice, study vocabulary, watch instructional videos and...
Shodor Education Foundation
Shodor Interactivate: Lesson: More Complicated Functions: Intro Linear Functions
In this lesson plan, learners learn about linear functions and how they can be represented as rules and data tables. Includes a worksheet with exploration questions to accompany an interactive Linear Function Machine. The lesson plan is...
CK-12 Foundation
Ck 12: Algebra: Functions That Describe Situations
[Free Registration/Login may be required to access all resource tools.] Students learn to represent and solve real-world problems with functions. Students examine guided notes, review guided practice, watch instructional videos and...
CK-12 Foundation
Ck 12: Algebra: Function Notation
[Free Registration/Login may be required to access all resource tools.] In this lesson students learn how to use function notation. Students examine guided notes, review guided practice, watch instructional videos and attempt practice...
Other
Nearpod: Distance Time Graphs
In this lesson on distance-time graphs, students will understand graphing by analyzing distance-time graphs.
Science Education Resource Center at Carleton College
Serc: Flow Characteristics of the Crow River
Students make observations of a local river, and then formulate a question. Then, through guided inquiry, construct, conduct, and collect data on a question they wish to research. Students keep a field journal of their observations,...


