Curated OER
Temperature Graphing
Students analyze temperature variations throughout the world by using computer graphing of select major national and international cities. After analyzing their findings, students write a paragraph explaining their data.
Curated OER
Genetic Variations in Hand Span Size
Students study genes. In this biology lesson plan, students measure their handspan size to determine if one pair or many pairs of genes control that trait.
Curated OER
Canada's Climate: Temperature and Rainfall Variations
Students analyze data about various climates in Canada. In this data analysis and climate lesson, students use Canada Year Book 1999 to complete a worksheet and make connections between precipitation and temperature in different climates.
Curated OER
Temperature High and Lows
Learners gather high and low temperature readings through email. For this temperature graphing lesson, students use a spreadsheet to input data for a graph. learners interpret the graphs to compare and contrast the data from different...
Curated OER
Cookie Mapping
Students study the components of a bedrock geology map through a hands-on activity involving a cookie and graph paper.
Curated OER
Do the Elephants Need Sunscreen? A Study of the Weather Patterns in Etosha
Learners analyze the weather patterns in Namibia. They create a graph of the yearly temperatures and use the internet to gather information. They discuss how the weather goes in cycles in the area.
Curated OER
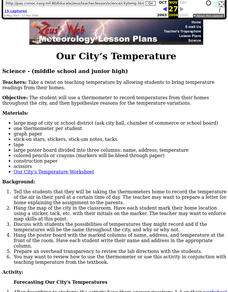
Our City's Temperature
Students use a thermometer to record temperatures from their homes throughout the city, and then hypothesize reasons for the temperature variations. They use a weather graph worksheet that's imbedded in this lesson to orgainize their data.
Curated OER
More Rocket Science
Young scholars observe two rocket science experiments, and create a graph to demonstrate the results. They draw a picture and write an explanation of the results of the experiments.
Curated OER
Connecticut Wildlife: Biodiversity and Conservation Status of Our Vertebrate Populations
Students explore the different types of vertebrates found in their area. In this environmental science lesson, students perform a case study on the Common Raven. They analyze data collected from research and create charts and graphs.
Curated OER
From Playing with Electronics to Data Analysis
Students collect and Analyze data. In this statistics lesson, students identify the line of best fit of the graph. They classify lines as having positive, negative and no correlation.
Curated OER
Mathematical Models with Applications: The Sounds of Music
Pupils use an electronic data-collection device to model the sound produced by a guitar string. They identify the graph of a periodic situation and use the graph to determine the period and frequency of sound waves.
Curated OER
Absolute Value Inequalities
Students solve inequalities. In this absolute value lesson, students solve inequalities containing absolute value. They graph the solution of each problem.
Curated OER
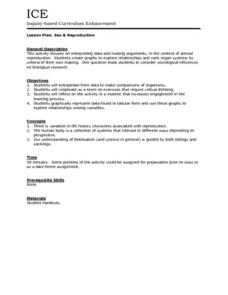
Sex & Reproduction
Students examine animal reproduction by interpreting data and making arguments and then create their own graphs to explore relationships of organ systems. This lesson plan includes an individual worksheet and a reflective review...
Curated OER
Cancer: A Crisis of the Cells
Pupils analyze cancer data represented in graphs and charts. They describe the changes in cell structure and function as the result of cancer. They also examine phenomenas that are believed to cause cancer.
Curated OER
Picnic Possibilities
Fourth graders plan a picnic using weather data. Using accumulated weather data from various sources, they create a graph of the weather conditions in their region for a given period of time. Students interpret this data to predict the...
Curated OER
$$$eaweed
Students compare and evaluate the world's different seaweeds. In this investigative lesson students study seaweed and the harvesting of it. They then interpret the data collected and graph the seaweed production.
Curated OER
Fish Parasite Survey
Students survey and dissect as many fish as possible. They count nematodes, cestodes and crustaceans on the fish, fill out autopsy reports, and transfer data to a chalkboard data table. Students graph the results of the entire class...
Curated OER
Skittles and Springs
Students experiment to discover the relationship between the stretch of a spring and the amount of weight attached to the spring using Skittles. They use a CBR and a graphing calculator to gather data.
Curated OER
How Does Temperature Vary Over Time?
Students examine the temperature flucuations on the Earth. After defining new vocabulary, they identify the flucuations of the Earth on a map. As a class, they develop a hypotheis on the temperature variation by examining the data.
Curated OER
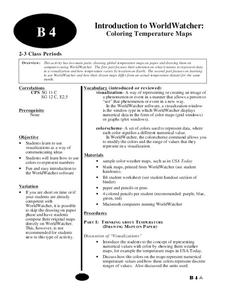
Introduction to WorldWatcher: Coloring Temperature Maps
Students are introduced to the software program WorldWatcher. In groups, they discover the temperature variations throughout the world and color a map according to the temperatures. They also practice using visualization to communicate...
Curated OER
"Ball Bounce" Quadratic Functions
Young scholars manipulate a ball and explore quadratic functions. In this algebra instructional activity, students analyze the graph of a quadratic function. They identify quadratic properties.
Curated OER
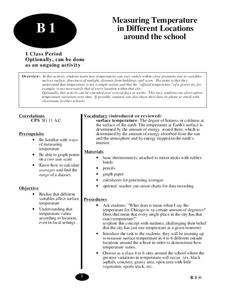
Measuring Temperature
Students explore the different variables that affect surface temperature. They study how temperatures can vary widely within close proximity due to variables such as surface, directness of sunlight, and distance from buildings.
Curated OER
Permutations
In this permutations instructional activity, 6th graders solve and complete 5 different types of problems. First, they write a simple conceptual art plan with no more than 3 instructions. Then, students use graph paper and a pencil to...
Curated OER
Population Dynamics of Growth of Drosophila
Students experiment with Drosophila to determine if density of female flies, food sources, temperature and light affect the population dynamics of growth. Students graph their data and compare their results to the number of human...


