Curated OER
Range and Mode Reteach 4.5
In this range and mode worksheet, students analyze the data table and graph that show numbers of books read. Students use the data to answer 4 questions.
Curated OER
Math: Football Fever Fun
Students compile statistics from high school or other football team and construct a spreadsheet on which to record their findings. Using Chart Wizard to analyze the data, they construct charts and graphs for a visual display of the...
Curated OER
Misleading Graphs
Students explore number relationships by participating in a data collection activity. In this statistics instructional activity, students participate in a role-play activitiy in which they own a scrap material storefront that must...
Curated OER
Motion on an Inclined Plane
In this physics worksheet, students model the acceleration, velocity, and position of a cart moving up an inclined plane. They take data and determine a pattern in the data. Students also describe their findings and create an illustration.
Curated OER
The Great Race
Students identify the mean, median and mode of collected data. In this statistics instructional activity, students collect, graph and analyze data using central tendencies. They work in groups to collect data on a robot through an...
Curated OER
Mean, Median and Mode
Fourth graders describe weather data using the mean, median and mode. In this mean, median and mode lesson, 4th graders understand how to calculate data using mean, median and mode and why they would use each one.
Curated OER
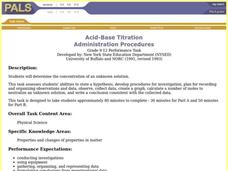
Acid-Base Titration
Students determine the concentration of an unknown solution. This task assesses students' abilities to state hypothesis, develop procedures for investigation, plan for recording and organizing observations and data, collect data, create...
Curated OER
Calculating Buttons
Students, after reading "The Button Box" by Margarette S. Reid, analyze real-world data by surveying a sample space. They predict the generalization onto a larger population utilizing calculators and computers. Students total categories,...
Curated OER
Probability Lesson Plan
Your learners will examine probability through experiments and dice games. Using a computer, your class will perform simple experiments to collect and analyze data to determine the probability of different experimental results. Young...
Curated OER
Local Traffic Survey
Young scholars conduct a traffic survey and interpret their data and use graphs and charts to display their results.
Curated OER
Paws in Jobland: Lesson Plan 35 - Catch of the Day
Students study information for fish farm workers given in the form of a chart, in order to practice interpreting data while learning about the career of a fisherman. In this data interpretation instructional activity, students read the...
Curated OER
Sorting and Graphing Animals
Students inquire about animals using SIRS Discoverer or eLibrary Elementary. In this organizing data lesson, students sort pictures of animals in various ways and develop graphs. Students locate a mammal, reptile, fish, insect or bird...
Curated OER
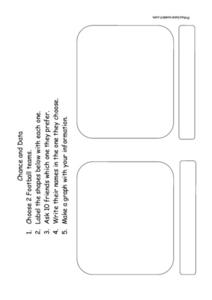
Chance and Data - Data Collection
In this data and probability worksheet, students choose two football teams and label the graphic organizer. They question 10 friends as to which team they prefer and write their names in the organizer. They make a graph that displays the...
Curated OER
Data Analysis Digital Display
Students create a survey online. In this math lesson, students graph survey data using flisti.com. They share and analyze their classmates' histogram.
Curated OER
Collecting Data
In this data collection worksheet, students read about how data is collected and organized. They also learn about a hypothesis. Students read through examples of different charts and then answer 23 questions pertaining to data...
Curated OER
Graphing Ordered Pairs
Seventh graders investigate the concept of ordered pairs as found in Algebra. They are introduced to the data set that corresponds to the coordinate system. Also students practice the graphing the ordered pairs using the x and y axis.
Curated OER
Graphing Data
First graders explore the concept of graphing. In this data lesson, 1st graders gather information from a class survey and display their findings on a picture graph. Students also practice solving problems that their instructor models.
Curated OER
Shopping With a Circle Graph
In this shopping with a circle graph worksheet, students use the data in the graph to answer 8 questions about the money they have and how they can spend it.
Houston Area Calculus Teachers
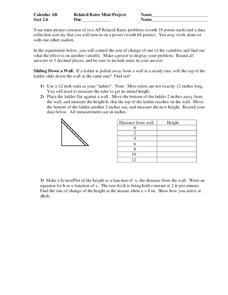
Related Rates
Use a hands-on approach to exploring the concepts of related rates in your AP Calculus class. Individuals explore the effect of the rate of change on a variable related to a variable they control. After analyzing the data they collect,...
Curated OER
Asthma Survey
Learners collect survey data on the prevalence of asthma in a community. They summarize and display the survey data in ways that show meaning.
Curated OER
Charts and Graphs
Fifth graders interpret data into graphs and percentages. In this organizing data lesson, 5th graders discuss bar, circle and line graphs. Students complete bar graph and apply probability using the results.
Pennsylvania Department of Education
Use Order of Operations to Evaluate Expressions—No Grouping Symbols
Students identify and explain different types of data collection and graphs. For this graphs and data collection lesson, students record their observations of a variety of data collection tools and graphs displayed in the room. Students...
Curated OER
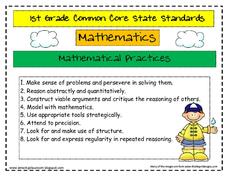
Common Core State Standards 1st Grade Math
Here are the complete set of the math practice standards and the Common Core standards for first grade. They cover operations & algebraic thinking, operations in base 10, measurement and data, and geometry. Illustrated nicely with...
Other popular searches
- Data Display
- Misleading Data Display
- Appropriate Data Display
- Graphs and Data Display
- Data Display Center
- Voluntary Data Display
- Best Data Display
- Data Display and Analysis
- Rates and Data Display
- Simulation Data Display
- Ways to Display Data
- And Display Simple Data


