Curated OER
Which Time of Day Do You Like Best?-- Class Bar Graph
In this math instructional activity, students collaborate in making a bar graph which displays their favorite time of day: art, music, gym or library. The class is surveyed and responses are plotted on this graph.
Curated OER
Which Kind of Weather Do You Like Best? -- Class Bar Graph
In this math learning exercise, students generate a class bar graph. Classmates are surveyed about favorite weather: sunny, rainy, snowy, cloudy or windy. Results are displayed on a bar graph.
Curated OER
Graphs
Students explore graphs and define the different ways they are used to display data. In this algebra lesson, students collect data and plot their data using the correct graph. They draw conclusions from their graphs based on their data.
Curated OER
Leonardo da Vinci
Students select appropriate tools and technology to perform tests, collect data, and display data. They construct appropriate graphs from data and develop qualitative statements about the relationships between variables.
Curated OER
A Class Census
Students recognize that data represents specific pieces of information about real-world activities, such as the census. In this census lesson, students take a class and school-wide census and construct tally charts and bar graphs to...
Curated OER
Buzzing is BEE-lieving
Students investigate insects. In this insect activity, students explore various insect models and identify the characteristics of each. Students observe insects outside and tally how many insects they observe.
Curated OER
Virtual Field Trip
Are we there yet? Young trip planners learn about their state and plan a trip. They will select sites to see in three cities in their state, and record associated costs in a spreadsheet. While this was originally designed as a...
Curated OER
Bones and Math
students identify and explore the connection between math and the bones of the human body. Students collect data about bones from their classmates and from adults, apply formulas that relate this data to a person's height, and organize...
Curated OER
Graphing Pockets
Second graders explore graphing. They count the number of pockets on their clothes and use Microsoft Excel to enter their data. Students create a class graph displaying their findings.
Curated OER
A Picture is Worth a Thousand Words
Sixth graders work to write questions for a class survey. In this survey lesson, 6th graders survey their class members by asking the 4 questions they developed and will record their answers on the culminating assessment...
Curated OER
Awesome Animals
Pupils collect data from classmates about their favorite animal. They use the ClarisWorks graphing program to enter data, graph results, and interpret data.
Curated OER
We Are Having a Party! Part I
Second graders use data analysis skills in order to plan a class party. They graph possible times for the party noting the range for times. They discuss how mathematicians find and use the range to analyze data.
Curated OER
You Are What You Eat (High School)
Young scholars evaluate data from a statistical chart or graph which they find in a newspaper or magazine.
Curated OER
Meatiest States: Graph Problem Solving
In this graph problem solving instructional activity, students analyze a graph that shows commercial red meat production in five states. Students answer 5 word problems using the data on the graph.
Curated OER
Displaying The Data
Students engage in a research project to find information about one's personal family heritage. They collect information by conducting family interviews. Students use the data to create a graph, map, and timeline. Then students take part...
Curated OER
Central Tendencies and Normal Distribution Curve
Fourth graders are given data (class test scores) to determine central tendencies, and find information needed to construct a normal distribution curve. They become proficient in calculating mode, median and average.
Curated OER
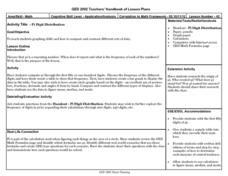
Pi Digit Distribution
Students study graphing skills and compare and contrast data sets. They compute pi through the first 50-100 digits and create a bar graph showing the frequencies of specific digits.
Curated OER
Graphic Favorite Breakfast Foods
Second graders graph data based on a class survey of their favorite breakfast foods. In this graphing lesson plan, 2nd graders take a class survey of their favorite breakfast foods. Then they take that data and put it into a computer...
Curated OER
Confusing Colors!
Fourth graders collect data, graph their data, and then make predictions based upon their findings. They's interest is maintained by the interesting way the data is collected. The data collection experiment is from the psychology work of...
Curated OER
Range and Measures of Central Tendency
Third graders take notes on a PowerPoint presentation featuring calculating and analyzing data. They practice skills highlighted in the presentation and create a table in Microsoft Excel showing data analysis.
Curated OER
"Weather Watch"
Students investigate components of weather and the climate in areas around the country. They analyze data from the University of Michigan weather website, complete a weather watch worksheet, and graph weather data.
Curated OER
Discovering Demographics
Students analyze demographic data including a statistical overview of India. Students synthesize their findings and create an informational poster about India.
Curated OER
A Solubility Curve for Potassium Nitrate
Step-by-step laboratory instructions are listed so that chemistry explorers can consider the solubility of potassium nitrate. They combined their results with other lab groups' results and then graphed the data to display the solubility...
Curated OER
Graphing the Forecast - Line Graph or Bar Graph?
Sixth graders compare and contrast bar and line graphs. Using a weather forecast of the area, 6th graders record the high and low temperatures in a table. Students determine and justify the most appropriate graph to display a given set...
Other popular searches
- Data Display
- Misleading Data Display
- Appropriate Data Display
- Graphs and Data Display
- Data Display Center
- Voluntary Data Display
- Best Data Display
- Data Display and Analysis
- Rates and Data Display
- Simulation Data Display
- Ways to Display Data
- And Display Simple Data


