Curated OER
Spyglass
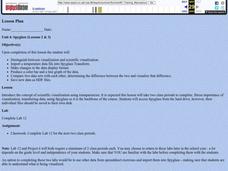
Students distinguish between visualization and scientific visualization. They use the software program Spygalss to create images from two-dimensional arrays of numbers.
Curated OER
Math Made Easy
Students evaluate word problems. In this problem solving lesson, students are presented with word problems requiring graphing skills and students work independently to solve.
Curated OER
Environmental Graphing
Young scholars experiment with graphing. In this graphing introduction lesson plan, students complete four activities: 1) a bar graph based on class birthdays 2) an estimation graph of the raisins in raisin bread 3) another estimation...
Curated OER
Exploring Probability
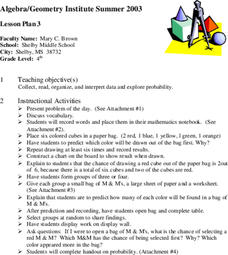
Fourth graders participate in a lesson that explores probability. They use candy and model cubes to experiment with different outcomes that can be charted if the students can proceed to the objective of the lesson. They discover how...
Curated OER
Skittles® in the Middle
Fourth graders work in small groups, using bags of Skittles?? to determine the mean of one color of Skittles?? found in each bag, in each group, and in the entire class. This is a good lesson to help motivate students to explore mode,...
Curated OER
Laura Ingalls Wilder Author Study
Fifth graders explore use of computers. They use technology tools to collect, analyze and display data. Students create and format a document using word processing. They participate in a curriculum-based telecommunications project.
Curated OER
Successful Resource-based Learning Strategies for the Geography of Canada Course
Students conduct a statistical research project on population changes. They evaluate demographic issues, such as the size and location of native people. immigrant groups, and the age and gender of the population.
Noyce Foundation
Ducklings
The class gets their mean and median all in a row with an assessment task that uses a population of ducklings to work with data displays and measures of central tendency. Pupils create a frequency chart and calculate the mean and median....
EngageNY
Informally Fitting a Line
Discover how trend lines can be useful in understanding relationships between variables with a lesson that covers how to informally fit a trend line to model a relationship given in a scatter plot. Scholars use the trend line to make...
University of Colorado
The Moons of Jupiter
Can you name the three planets with rings in our solar system? Everyone knows Saturn, many know Uranus, but most people are surprised to learn that Jupiter also has a ring. The third in a series of six teaches pupils what is around...
University of Colorado
Happy Landings: A Splash or a Splat?
Huygens spacecraft landed on Saturn's moon Titan in 2005, making it the farthest landing from Earth ever made by a spacecraft. In this hands-on activity, the 12th installment of 22, groups explore how density affects speed. To do this,...
College Board
2008 AP® Statistics Free-Response Questions Form B
To know what is on the test would be great. The six free-response question from the second form of the 2008 AP® Statistics gives pupils an insight into the format and general content of the exam. Each question requires the test taker to...
University of California
Hot! Hot! Hot!
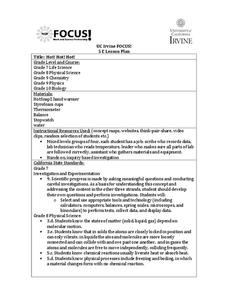
Calories are not tiny creatures that sew your clothes tighter every night, but what are they? A science activity, presented at multiple levels, has learners experiment with heat, heat transfer, and graph the function over time. It also...
EngageNY
End-of-Module Assessment Task - Algebra 1 (Module 2)
Check for understanding at the end of your descriptive statistics unit with an end-of-module assessment. It uses five questions to measure progress toward mastery of descriptive statistics standards. Each question is developed to address...
College Board
2005 AP® Statistics Free-Response Questions
A little context will go a long way. The six released free-response questions from the 2005 exam, show how AP® Statistics uses context within their problems. Pupils use the questions to practice their statistics skills within real-world...
College Board
2006 AP® Statistics Free-Response Questions Form B
Test a significant review of statistical questions. The resource provides pupils and teachers with insight into the way the exam assesses statistical concepts. Half of the released questions from the 2006 AP® Statistics Form B questions...
CK-12 Foundation
CK-12 Middle School Math Concepts - Grade 6
Twelve chapters cover a multitude of math concepts found in the Common Core standards for sixth grade. Each title provides a brief explanation of what you will find inside the chapter—concepts from which you can click on and learn more...
Curated OER
3 Kinds of Graphs
Students construct three different graphs-a line graph, a bar graph, and a circle graph. In this graphing instructional activity, students use different graphs to display various data that they collect.
Curated OER
Room Temperature Investigation
While the topic of this investigation is not specific to any particular discipline of science, it does serve as a practice of the scientific method. Learners set up a bowl containing boiling water, one with room temperature water, and...
Curated OER
Party, Party, Party
Second graders conduct investigations with counting, comparing, organizing, analyzing, displaying and interpreting data. They pose questions for investigation and collect the data. Students display the data in tally charts, uniform...
Curated OER
Super Spreadsheets
Learners develop a spreadsheet containing statistical data. They describe and interpret the data to make conclusions. They review the differences between an unorganized spreadsheet verses an organized one.
Curated OER
Scientific Graphs
Students organize data collected from their experiments using graphs. For this statistics and biology lesson, students organize their scientific data from an article into readable graphs. They define the usefulness of their graph and...
Curated OER
Childhood Obesity
Students identify a question to generate appropriate data and predict results. They distinguish between a total population and a sample and use a variety of methods to collect and record data. Students create classifications and ranges...
Curated OER
Paper Parachutes
Students participate in a simulation of a parachute-jump competition by making paper parachutes and then dropping them towards a target on the floor. They measure the distance from the point where the paper parachute lands compared to...
Other popular searches
- Data Display
- Misleading Data Display
- Appropriate Data Display
- Graphs and Data Display
- Data Display Center
- Voluntary Data Display
- Best Data Display
- Data Display and Analysis
- Rates and Data Display
- Simulation Data Display
- Ways to Display Data
- And Display Simple Data


