Curated OER
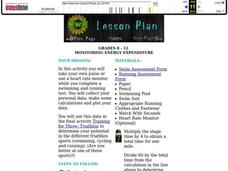
Monitoring Energy Expenditure
Students use heart rate monitors and complete a swimming and running test. These tests allow students to obtain personal data, to manipulate the data through calculations of various parameters, and to graphically represent the data.
Curated OER
Exercise Those Statistics!
Students participate in various activities, measuring their pulse rates and recording the data. They analyze the statistical concepts of mean, median, mode, and histograms using the data from the cardiovascular activities.
Curated OER
Identifying Creatures
Young scholars use a classification key from a provided worksheet to identify creatures. This task assesses student's abilities to interpret data, make decisions, identify, and classify.
Curated OER
Rolling Down Hill
Students perform an experiment, collect, and analyze data of a rolling marble down a ramp. They report results after they complete their experiment. Students are assessed in science and writing.
Curated OER
Crustal Sinking
Students measure the rate of sinking of a test tube into a beaker of "glop", representing a model of the interaction between the Earth's crust and upper mantle. This task assesses students' abilities to make simple observations,...
Curated OER
What Are The Chances
Students calculate the probability of an event occurring. In this probability lesson, students differentiate between independent, dependent or compound events. They find the range of the data.
Curated OER
Jack-O-Lantern Glyph
Young scholars create a jack-o-lantern glyph that accurately represents his or her answers to a series of questions. The completed jack-o-lanterns are displayed in the classroom and the class interprets the data.
Curated OER
Millions, Billions, Trillions
Students use real-world data to compare the relative sizes of millions and billions, and exponential growth. They use the salaries of famous people such as, Michael Jordan and Bill Gates to understand this math concept.
Curated OER
Line Graphs and Commercial Costs
Students investigate line graphs. For this middle school mathematics lesson, students compare and contrast different types of graphs and create line graphs based on the data provided.
Curated OER
How Far is Far?
Students calculate the standard deviation of data. In this statistics lesson, students collect data, plot it and analyze it. They identify the mean, median and range of their data.
Curated OER
A Healthy Heart
Sixth graders create a spreadsheet using specific data. A speaker comes to discuss the heart, and the difference between anaerobic and aerobic activity. They make posters to encourage a healthy heart lifestyle.
Curated OER
Journal of the Stars
Students receive balloons representing the "Life Cycle of the Stars." As the attached script is read, students follow the directions for the color of balloon they are given. Students chart the results for their star. They plot data from...
Curated OER
I'm a Weather Watcher Watching plants grow by......my,my,my
Students investigate how weather affects how plants grow. They collect data on weather and plant growth for a week and display the data on a graph. For a culminating experience they design a movie using software that shows plant growth...
Curated OER
Word Power
Fifth graders identify a set of data from a real world problem. For this statistics lesson, 5th graders identify the range, mode, median and mean using some manipulatives. They write words randomizing the letters.
Curated OER
Equation of a Line
In this equation of a line worksheet, 9th graders solve and complete 4 different multiple choice problems. First, they use the median fit method to determine the equation that most likely represents the line of best fit for the data...
Curated OER
Tuned in: Tuning Forks and Sine waves
Students explore the characteristics of a pure sound wave produced by a tuning fork. They use sine waves to find a curve to fit the sound wave data produced by the tuning fork. A CBL and microphone is required for this activity.
Curated OER
Starch and Sugar Testing 1
Eighth graders determine the presence of starch and sugar in unknown solutions. This task assesses students' abilities to observe, record and interpret data, classify, generalize/infer, construct data tables, and identify sugar and...
Curated OER
Internet Field Trip: Simple Machines
Learners observe and identify the types of simple machines. They conduct research and gather data to increase the comprehension of simple machines. Students identify and comprehend data to complete a graphic organizer and focus...
Curated OER
Threads
Learners group observed data, filtering from all their observations the similarities between burring threads. In the second part they make a comparison of a chosen attribute between the two threads.
Curated OER
Water Quality in the Greenhills Stream
Seventh graders conduct year long study of water quality over different seasons using variety of probes, including D.O., pH, conductivity and temperature, that are attached to portable technology. Students select three data points in...
Curated OER
The Coyote Population: Kansas Prairies
Students discover animal lifestyles by researching their ecosystem. In this animal statistics lesson, students research the geography of Kansas and discuss the reasons why wild animals survive in the open Kansas fields. Students complete...
Curated OER
What's the Chance?
Students study probability and statistics by conducting an experiment, recording their results, and sharing data with classmates.
Curated OER
Blue
Students follow directions for a simple chemical experiment. They use the appropriate tools and techniques to gather, analyze, and interpret data. Students identify a substance that has characteristic properties, such as density, a...
Curated OER
Water Regulation
Students use their basic knowledge of physiology to analyze graphical data of paramecia under diverse conditions. From the data analysis, Students develop explanations of the animal's response to the concentration of different solutions...
Other popular searches
- Data Display
- Misleading Data Display
- Appropriate Data Display
- Graphs and Data Display
- Data Display Center
- Voluntary Data Display
- Best Data Display
- Data Display and Analysis
- Rates and Data Display
- Simulation Data Display
- Ways to Display Data
- And Display Simple Data


