Curated OER
Water Fun
Students examine uses for water. In this water lesson, students discuss how they use water. As a class students make a PowerPoint by naming one swimming safety rule. Students compare and contrast fishing for fun and fishing for survival.
Curated OER
Harvest the Facts
Learners discover heath problems caused by tobacco. In this human health lesson plan, students identify the many diseases tobacco use causes and how to prevent such diseases. Learners investigate the organs in the human body directly...
Curated OER
A Weigh we Go!
Here are some cross-curricular activities whil should help your kids understnad weight measurements and grammar. In this grammar and math lesson, students read the book Skittles Riddles and practice counting and balancing skittles. They...
Curated OER
Critter Museum
Students act as directors of a new science museum where they have decided to set up a display of animals without backbones that are found in the area. To organize their display, they need to sort and classify a collection of animals and...
Curated OER
Friction Force
High schoolers investigate friction force on a variety of objects such as bricks and cardboard boxes. They use a force probe to collect data on the changes in force required to drag the objects across a variety of surface types.
Curated OER
Education for Global Peace
Students survey the class and graph the results. In this graphing and data collection lesson, students conduct a survey to see where their shirts were produced. Individuals use software to graph the results and create a written...
Curated OER
Fractions, Decimals, and Percents
Students connect different mathematical concepts. They create a circle graph. Students then create a question in which they collect data in order to convert fractions to decimals and decimals to percents.
Curated OER
Spreadsheet Budget Project
Eighth graders record all the food they eat for one week, compute the costs for all of this food, and display the different categories on a spreadsheet and then convert to a chart.
Curated OER
Ecosystems
Students create plots of land in three different ecosystems and use AppleWorks to collect data for research. This lesson includes a downloadable worksheet and can be accomplished in four days.
Curated OER
Planet Protectors
Students explore ways to protect the earth. In this environmental issues and technology activity, students investigate the water quality in their community and compare their findings to the water quality in other geographic areas. ...
Curated OER
What Are We Listening To?
Students gather data from a web site on number of music albums sold by genre for the last two years. They convert these figures to fractions, decimals, and percents, and display the results in bar graphs and pie charts.
Curated OER
Graphing Valentine Candies
Fifth graders organize and display information in bar graph form using appropriate labels. Each student receives a box of Valentine heart candies, a worksheet of the tally chart and a worksheet of the bar graph.
Curated OER
Cultural Ties in Your Nebraska Community
Tenth graders use different resources to collect data about how their specific community is affected by international ties and relations. Resources include local library, city hall, travel agent, visitors bureau, and Chamber of...
Curated OER
Finding Mean, Mode and Median in the Computer Lab
Students create spreadsheets which will display and figure mean, median, and mode of a set of numbers.
Curated OER
How Effective is Perspiration at Cooling?
Students collect data on the cooling of water in two different test tubes, one that is wrapped in wet newspaper and one in dry newspaper. They then relate this cooling effect to the body's perspiration.
Curated OER
Christmas Tree
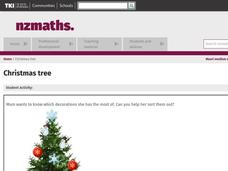
Ask the students for ideas on sorting the decorations so that they could tell someone what was in the box. Students share idea for sorting a box of Christmas decorations so that they could tell someone what was in the box. They share...
Curated OER
Stimulus/Response in Invertebrates
Students design and conduct and experiment to determine how invertebrates react to an outside stimulus such as light and other stimuli. Student must develop a clear plan of action, collect data in an organized manner and analyze their...
Utah LessonPlans
Seed Sort
Students form a variety of categories for seed mixes (wild bird seed or 15 bean soup) and create graphs to display their categories.
Curated OER
A Bar of Many Colors
Second graders use colored candies to collect data, construct double bar graphs, and find averages.
Smithsonian Institution
Picturing George: A Pictorial Survey of the Life of George Washington
Students create pictorial biographies of George Washington. Working in groups, they research various portions of Washington's life, highlighting significant events. After presenting their projects to the class, they are displayed for...
Curated OER
Traffic Light Probability
Students discuss the possible traffic signals that may be observed on the way to a field trip. They record data on the trip, and analyze the probability of the results occurring again.
Curated OER
Growing and Graphing
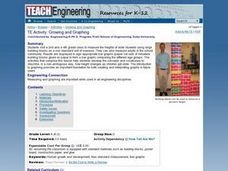
Students visit a 2nd and a 4th grade class to measure the heights of older students using large building blocks as a non-standard unit of measure. They can also measure adults in the school community. Results are displayed in...
Curated OER
Favorite Foods at Thanksgiving
Fourth graders study different types of graphs as a means of displaying information. They survey others to find their favorite Thanksgiving food and then graph the results using different types of graphs.
Curated OER
How to Make Histograms
Students collect data and plot it using a histogram. In this statistics lesson, students interpret histograms. They find the frequency, percents and density.
Other popular searches
- Data Display
- Misleading Data Display
- Appropriate Data Display
- Graphs and Data Display
- Data Display Center
- Voluntary Data Display
- Best Data Display
- Data Display and Analysis
- Rates and Data Display
- Simulation Data Display
- Ways to Display Data
- And Display Simple Data


