Curated OER
Polling and Statistics
Young scholars investigate polling. In this statistics lesson, students collect data-on polling and graph their data on a coordinate plane. They identify biased and non-biased polling.
Curated OER
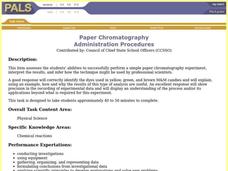
Paper Chromatography
Small groups of students perform paper chromatography to separate food dyes into their component colors. Students perform the experiment and collect, organize, and represent their data to form an explanation of their outcomes. Students...
Curated OER
Move To a Healthier Aquatic Balance
Fourth graders examine aquatic orgnaisms and how enviromental chages affect them. This factors include: temperature, Ph, oxygen, nutrients, and pollutants. They also explore habitat quality (erosion). Students compile data and create...
Curated OER
Let's Take a Chance!
Students investigate probability and the chance of an even happening. In this algebra lesson, students incorporate their knowledge of probability to solve problems and relate it to the real world. They learn to make decisions based on data.
Curated OER
Heat Loss
Students comprehend how heat loss is affected by exposed surface area. They decide what type of and how many data to
collect. Students decide how the results should be presented. They make a series of accurate observations
Curated OER
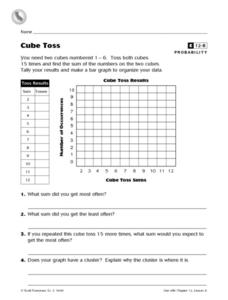
Cube Toss
In this probability and graphing worksheet, students solve 8 problems in which data from a cube toss is displayed on a table and graph. Students answer the questions about their results.
Curated OER
Practice Dividing by 8
In this dividing by 8 worksheet, students use the data in the math table to help them complete the pictograph chart on the right. Students use the pictograph to help them answer the six word problems.
Curated OER
My Perfect Pet
Students explore pet ownership. In this my perfect pet lesson plan, students research common animals used as pets and complete a variety of activities based on this data.
Curated OER
Planet Research and Brochure
Fourth graders design a brochure based on the planet that they researched. In this planets lesson plan, 4th graders include the data, important facts, and completed as a team.
Science Matters
Slip Sliding Along
The San Andreas Fault is the largest earthquake-producing fault in California. In the seventh lesson in the 20 part series, pupils create maps of California, focusing on the San Andreas Fault system. The comparison of where California is...
Curated OER
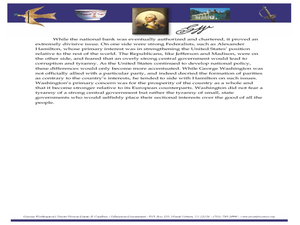
Using Political Cartoons to Understand Historical Events
Examine historical perspectives through the use of political cartoons. Learners complete analysis activities related to the president's title, the establishment of the national bank, and the Jay Treaty.
National Geographic
Mapping the Shape of Everest
With Mount Everest as the motivator, your earth science class learns about topographic maps. Begin by showing a film clip from The Wildest Dream: Conquest of Everest, featuring fearsome virtual imagery of a path up world's tallest peak....
Illustrative Mathematics
Telling a Story With Graphs
Turn your algebra learners into meteorologists. High schoolers are given three graphs that contain information about the weather in Santa Rosa, California during the month of February, 2012. Graph one shows temperatures, graph two...
Curriculum Corner
“I Can” Common Core! 1st Grade Math
Any first grader can master the Common Core math standards with this checklist! With each standard rewritten as an affirmative I can statement, children are provide with clear goals to work toward throughout the school year.
Display an...
Smarter Balanced
Food Waste and Food Access
Forty percent of food in the US goes uneaten while 14.5 percent of US households lack a secure supply of food. As part of the preparation for a performance task assessment, groups consider statistics such as these about food waste and...
AIMS Education Foundation
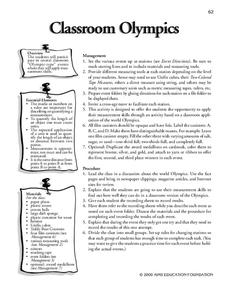
Classroom Olympics
As the Summer Olympics are approaching, incorporate Olympic-type games into the classroom. From straw javelin to cotton ball shot put, these games are sure to keep leaners engaged. The best part is that there is math involved! Pupils...
Curated OER
Convection Currents
Students explain and understand the circulation of air in the atmosphere. They identify that energy can be carried from one place to another by heat flow or by waves, including water, light and sound waves, or by moving objects. ...
Curated OER
Blank Bar Graph- Intervals of 3
In this bar graph worksheet, students use the blank bar graph grid to display data. The interval is counting by 3. There are no problems given.
Curated OER
School Yard Waste
Fourth graders examine the types of garbage that they collect on the playground. They collect the information in a spreadsheet and create a graph that displays the number of types of trash found. They design and monitor a playground...
Curated OER
Monitoring an Epidemic: Analyzing Through Graphical Displays Factors Relating to the Spread of HIV/AIDS
Tenth graders differentiate pandemic and epidemic. In this health science lesson plan, 10th graders analyze how HIV and AIDS affect different countries. They construct and interpret different types of graphs.
Discovery Education
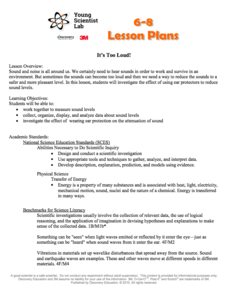
It's Too Loud!
STEM scholars investigate sound attenuation by conducting an experiment in which they compare the farthest distance that they can hear a sound with and without ear protection.
Curated OER
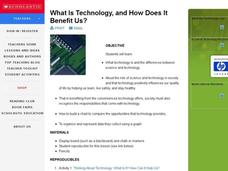
What Is Technology, and How Does It Benefit Us?
Young scholars examine and define what technology is as well as the differences between science and technology. They assess the role of science and technology in society, conveniences technology offers and create a chart to compare the...
Curated OER
Clouds
Students explore basic cloud types and the weather associated with each one. In this earth science lesson, students participate in numerous activities including going outside to observe the clouds they see, making a cloud in a jar,...
Curated OER
Design Patterns in Everyday Life
Students find symbols and patterns in everyday life. In this patterns lesson, students break into groups and look for specific patterns and symbols. Students record their findings. Students create a graphic organizer with the information.
Other popular searches
- Data Display
- Misleading Data Display
- Appropriate Data Display
- Graphs and Data Display
- Data Display Center
- Voluntary Data Display
- Best Data Display
- Data Display and Analysis
- Rates and Data Display
- Simulation Data Display
- Ways to Display Data
- And Display Simple Data


