Curated OER
Career Connections
Students use online self-assessment inventories to aid them in making career decisions. In this career decisions lesson, students visit the given website and identify their strengths and weaknesses. Students complete an online...
Curated OER
Career Connections: The Connection Corner
Students will create a career information center. In this careers lesson, students research careers on a local and national level and create a help wanted ad for an occupation of personal interest. Students create a brochure and...
Curated OER
PowerPoint Presentation
Young scholars learn how to design and create a PowerPoint presentation that they then present to the class.
Curated OER
Weather "Whys" : Introduction to Weather
Students discuss weather forecasts and different types of weather. In this weather instructional activity, students observe the weather and learn a weather song. They listen to a story and see weather measurement tools.
Curated OER
Nutrients
Fourth graders understand the important nutrients in food and the value of each. In this nutrients lesson, 4th graders complete a chart giving examples of foods that contain that nutrient and a definition of the nutrient. Students...
Curated OER
Weather "Whys" Lesson 2 Seasons
Young scholars explore seasons. In this cross curriculum weather and seasons lesson plan, students identify characteristics of the four seasons and sequence related pictures. Young scholars listen to poems and stories about trees in...
Curated OER
BMI For Kids - Body Mass Index
Promote healthy lifestyles with an interactive that provides young learners with healthy nutrition and exercise messages. Class members plug their height and weight information into an online body mass index calculator, and hear positive...
Curated OER
And the Winner Is...
Third graders participate in an election project. They collect data to create a spreadsheet from which a graph is generated.
Curated OER
Water Resources
Learners explore the differences between surface water and ground water. They collect data using maps and graphs and investigate a Texas river basin and a nearby aquifer. They complete a written report of their findings regarding the...
Curated OER
Who Turned the Lights Out?
Students discover the life cycle of butterfly by observing its growth from egg to caterpillar and the formation of its chrysalis. Students conduct an experiment in which they design housing for the chrysalises which are either in full...
Curated OER
Rotation Sensor Challenge
Students participate in a challenge to construct a rotation sensor with the highest degree of accuracy and repeatability. They conduct computer analysis of their sensor using repeated trial.
Curated OER
Jumping Rope-How Fit Am I?
Students collect data over a 10-week period in their Physical Education class on how many jumps they can do in a minute period or another time period specified by the instructor.
Curated OER
Carbondale: The Biography of a Coal Town
Students use a brief history of the growth and decline of the anthracite region in the state to create a photograph and map "peak shaped" time line. They practice map and photo analysis strategies to "read" photographs and maps.
Smithsonian Institution
Looking at a National Treasure: George Washington
Students explain the definition of a portrait. They identify the visual clues that Gilbert Stuart included in his portrait of George Washington. They compare the reproduction to other images of Washington. They discuss the importance of...
Curated OER
Getting Graphs: Researching Genealogy-A Piece of Pie
Third graders research their genealogy. In this math lesson, 3rd graders collect data and create graphs and charts. A presentation of their findings is given.
Curated OER
"How Tall, How Short, How Faraway" by David A. Adler
Students list in a journal what "measurement" is. They measure with standard and non-standard units and record data on a class chart. They also construct a meter tape.
Curated OER
Finding the Flu
Students work to determine when the flu is most prevalent in the United States. They gather data on their own, create calendar, charts, and graphs, analyze their findings and present them. This is a very appropriate winter lesson!
Curated OER
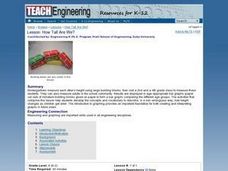
How Tall Are We?
Young scholars in a Kindergarten class measure each other's height using large building blocks and then visit a 2nd and a 4th grade class to measure those students. They display the results in bar graphs, comparing the different age groups.
Curated OER
Best Buy!!
Students use newspaper ads to determine the best buy on products. They enter the information into a spreadsheet and then use word processing software to complete a written analysis, complete with graphs.
Curated OER
Body Length Experiment
Students measure the lengths of their bodies and various body parts to determine the relationship (or lack of one) between body part length and the length of the entire body. A spreadsheet program is suggested for data collection.
Curated OER
The Garden
Students talk about the types of insects that you might see if you looked in the garden. They then brainstorm for ideas about how to solve the problem, sort objects into categories and display the results and count the objects in a...
Curated OER
Using technology to engage students in science through inquiry research
Students study animals and their behaviors. For this animal behavior lesson students divide into groups and collect data and research animal behaviors.
Curated OER
Learning About Our Five Senses
Students study the sense of touch and various degrees of heat. They design a model that displays how the human hand reacts to heat using a touch sensor.
Curated OER
Penguin Heights
Young scholars use the worksheet from the first website listed below to collect data on the penguin heights on the Penguin Page.
Other popular searches
- Data Display
- Misleading Data Display
- Appropriate Data Display
- Graphs and Data Display
- Data Display Center
- Voluntary Data Display
- Best Data Display
- Data Display and Analysis
- Rates and Data Display
- Simulation Data Display
- Ways to Display Data
- And Display Simple Data


