University of Georgia
Would Your Cat Eat This Stuff?
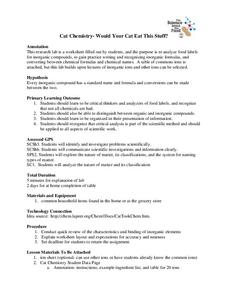
Processed foods use inorganic compounds for flavoring and preservation. This take-home laboratory challenges scholars to find 20 different compounds identified on the labels of foods to list on their data collection sheet. The activity...
Curated OER
Schools Going Solar
If your school has a photovoltaic system, you can use this lesson plan to guide learners through an investigation of the factors affecting performance. Familiarize yourself with the data acquisition system, and then provide data for your...
Illustrative Mathematics
Electoral College
A cross-curricular resource that takes the electoral votes and allows your learners to organize and analyze the data. Young voters can determine which states are more influential and interpret the dotplot provided for more data....
Curated OER
Rising Gas Prices – Compounding and Inflation
Financial literacy skills and exponential models are connected by the compound interest formula in this task centered on inflation calculations. Collaborative learners get experience collecting data from the given websites and exploring...
Museum of Tolerance
Where Do Our Families Come From?
After a grand conversation about immigration to the United States, scholars interview a family member to learn about their journey to America. They then take their new-found knowledge and apply their findings to tracking their family...
Mascil Project
Chocolate Chip Mining
Canada mines more minerals than any other country in the world. Scholars with a sample must determine how to get the mineral out while preserving as much of the rock as possible. They analyze the data and compare methodology while...
Workforce Solutions
Workforce Solutions 4-5 Lessons
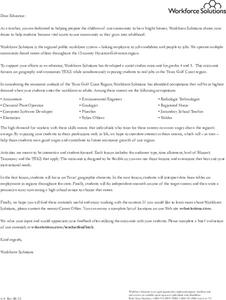
Four lessons focus on job opportunities in Texas. In the first instructional activity, scholars examine the geography of Texas in preparation for analyzing data that showcases the economy of different regions. Lesson three challenges...
Curated OER
Yummy Math
Young mathematicians use bags of Skittles to help them gain practice in graphing and organizing data. They work in pairs, and after they have counted and organized their Skittles, they access a computer program which allows them to print...
Curated OER
Matrix Operations
Two real-world activities to practice adding, subtracting and multiplying matrices to problem solve. Data from several Pro football quarterbacks is used in one activity to make some predictions based on their stats. Then the class takes...
Curated OER
Do I Have What it Takes to be an Entrepreneur - and is My Community Ready?
Discover the attributes of entrepreneurs and define what entrepreneurship is while examining data based on local businesses. Learners determine whether their community is supportive of entrepreneurs as they research economic development...
Rivanna Regional Stormwater Education Partnership
Does It Soak Right In?
Which materials are best for groundwater runoff, and which are best for percolation? Discuss the water table with several experiments about different types of soil, pollution, precipitation, and filtration. The experiments assign roles...
Institute of Electrical and Electronics Engineers
Fun with Speedboats!
After reading about marine engineers and naval architects, it's all hands on deck to design and test a speed boat. This lesson is designed for the Next Generation Science Standards in engineering and can be a centerpiece for a STEM...
Clarkson University
Understanding Energy (With a Pendulum)
Have you ever wanted to play with a giant pendulum? An experiment allows small groups to do just that. They gather data and make observations as they complete the included worksheet. The instructional activity lays out each instruction...
Tech Museum of Innovation
Hoop Glider Design Challenge
The fourth installment of a five-part unit has young engineers designing and testing hoop gliders. They adjust the ratio of the front loop and back loop of the glider to determine the best design for the longest flight.
Santa Monica College
Flame Tests of Metal Cations
Scientists used flame tests to identify elements long before the invention of emission spectroscopy. Young chemists observe a flame test of five metal cations in the fourth instructional activity of an 11-part series. Individuals then...
Santa Monica College
Titration of Vinegar
Titration calculations require concentration. The 10th lesson in an 11-part series challenges young chemists to use titration in order to determine the molarity and mass percent in concentrated vinegar. Analysis questions encourage...
Virginia Department of Education
Attributes of a Rectangular Prism
A change is coming. Pupils use unit cubes to investigate how changes in the length, width, and/or height affects volume and surface area. They extend the results to write and test predictions on the effect of changing multiple sides on...
Purdue University
Designing a Device Utilizing a Balloon Filled with Carbon Dioxide
Don't waste all that carbon dioxide. Scholars first produce carbon dioxide by mixing baking soda and vinegar. They measure the masses of the reactants and products to verify the law of conservation of mass. As a culminating activity,...
Workforce Solutions
Plan a Vacation
Challenge scholars to plan a vacation with a $5,000 budget. Learners review costs of transportation, meals, and entertainment while considering the number of people and destination. Worksheets provide information and well-organized...
Curated OER
You Are What You Eat (High School)
Students evaluate data from a statistical chart or graph which they find in a newspaper or magazine.
Curated OER
Tourism in London
Students discuss the tourist attractions that are in London. They examine how data can be manipulated by completing a worksheet. They plan a trip to a London attraction after conducting Internet research.
Curated OER
Graph and Compare the Adventure's Temperature Vs. Local Temperature
Students explore the concept graphing data. In this graphing data lesson, students use weather data from their local weather and some other city and graph them. Students plot the local weather vs. another city. Students record...
Curated OER
Charting Weight
Sixth graders record the weight of themselves and 3 family over a week, and then use that data to compile 2 bar graphs and 4 line graphs and answer a series of questions.
Curated OER
Awesome Animals
Students collect data from classmates about their favorite animal. They use the ClarisWorks graphing program to enter data, graph results, and interpret data.


