Curated OER
Scientific Investigation- Magnets
Students conduct a scientific investigation to determine if a magnet attracts paper clips through different materials. Students write out their procedures, collect data and present it in a table or chart, and analyze their results.
Curated OER
Antlion Pit Building Investigation
Students design and perform an experiment related to comparing and contrasting antlion pits. Given a set of parameters, students select a hypothesis and perform observations on antlion pits. They record data and use this date to support...
Curated OER
Sampling Distribution of Sample Means
Students collect data and crate a distribution sample. In this statistics lesson, students compare and contrast their collected data. This assignment requires the students to be comfortable with navigating the internet.
Curated OER
Neighborhood statistics
Students examine statistics relating to neighborhoods. They use the data to explain how a population affects their environment. They discuss how businesses use statistics to find out information about their clientele.
Curated OER
Sediment Deposition Lab
Learners set up a stream table, observe erosion, and record data on where various sizes of sediments settle. They draw conclusions as to what kind of sedimentary rock form in what locations.
Curated OER
Science and Technology
Students research inventions that have been created. In this historical technology lesson, students read the Harcourt Brace social studies textbook and discuss how inventors used graphs to display data. Students create a table to write...
Curated OER
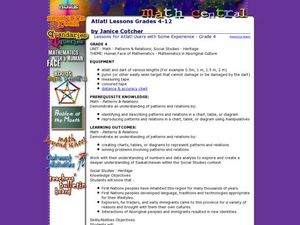
Atlatl Lessons for Grade 4
Fourth graders explore the weapons of the Aboriginal people. In this fourth grade math lesson, 4th graders create charts, tables, or diagrams to represent patterns and relations. Students investigate which dart length has the best...
Curated OER
Investing
Students collect data on investments and draw conclusions. In this algebra lesson, students analyze exponential graphs as they relate to money. They discuss the cause of an account balance being high or low.
Curated OER
Caldecott Medal Winners
Second graders identify Caldecott Medal winners. In this library media lesson, 2nd graders view an overhead transparency of Caldecott Medal winners from 1987-2004 and answer questions based on the data that is displayed.
Curated OER
Education for Global Peace
Fifth graders construct data graphs based upon sets of data. In this graphing instructional activity, 5th graders read the text If the World Were a Village and discuss how types of graphs accurately represent a large population. Students...
Curated OER
I Can Average Grades Like My Teacher!!!
Fifth graders investigate the mean of a data set. In this fifth grade mathematics lesson, 5th graders determine the mean of sets of numbers using a calculator. Students use a blank role book page to create grades for students and work...
Curated OER
Separation of Unknowns in a Liquid
Learners identify the different components of a given sample using chromatography. In this chemistry lesson, students compare paper and column chromatography. They collect data and construct data tables.
Curated OER
The Tragedy of the Commons
Ninth graders participate in a demonstration of the concept of "The Tragedy of the Commons." They conduct a "fishing" simulation demonstrating overfishing, complete two data tables, and answer discussion questions.
Curated OER
Modeling Earthquake Data
Young scholars evalute evolutionary theories and processe of Geology. They examine evidence that the movement of continents has had signicicant global impact, major geological events. Students evaluate the forces which shape the...
Curated OER
Comparing Linear and Exponential Data
Learners graph linear and exponential equations. In this algebra instructional activity, students differentiate between linear and exponential equations. They relate it to the real world.
Curated OER
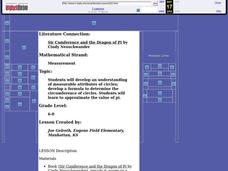
"Sir Cumference and the First Round Table" by Cindy Neuschwander
Students develop an understanding of measurable attributes of circles; develop a formula to determine the circumference of circles. They approximate the value of pi.
Curated OER
Survey Says...
Young learners create and implement a school-wide survey about student body favorites! Learners record and analyze the data on a bar graph, picture graph, and line graph, and then display the data. Then, wrap it all up with a celebration...
University of Washington
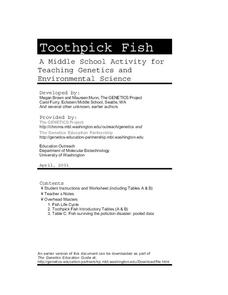
Toothpick Fish
With colored toothpicks representing genes, youngsters practice passing them through generations of fish and learn about heredity. Consider this as an introductory activity since it does not represent recessive genes with lowercase...
Curated OER
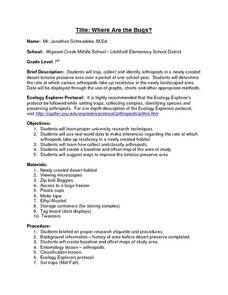
Where Are the Bugs?
Students trap, collect and identify arthropods in a newly created desert tortoise preserve area over a period of one school year. They determine the rate at which various arthropods take up residence in the newly landscaped area. Data is...
Curated OER
Collect, organize and compare different data for the Marine Mammals of the Miami Seaquarium, i.e.: size, weight, diet and habitat and how to calculate average, median, mode and range.
Students collect, organize, and compare different data and develop statistical methods such as: average, median, mode and range as a way for decision making by constructing table
Curated OER
Designing Models to Simulate Actual Events Using a Table of Random Digits
Learners design models to simulate actual events using a tale of random digits. They estimate the likelihood of a particular outcome using results of simulation. Students investigate the uses of statistical methods to analyze data.
Curated OER
Graphing Data
Second graders examine how to make and read bar graphs. In this bar graph lesson, 2nd graders compare bar graphs to pictographs by looking at hair color survey data. They practice making a bar graph and finding the range of the data.
Curated OER
The Accuracy of Climate Data
Students use maps to determine how accurate climate data really is. They also answer questions using a table of data.
Curated OER
Collecting, organizing and comparing data for cellular telephone buying and calculating average, and median price and best deal per cost.
Pupils research data and develop statistical methods such as mean and median price and make convincing arguments as powerful ways for decision making.


