Curated OER
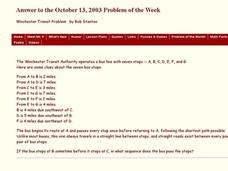
Winchester Transit Problem
In this transit problem worksheet, students read clues about bus stops and their routes. They determine the time between stops and the shortest path possible. This one-page worksheet contains 1 multi-step problem. The answer is provided.
Curated OER
Dragonfly
The speed of a dragonfly brings math into the real world as your learners collaboratively see the value in calculating unit rates in direct proportion problems. This six-phase lesson encourages you, as the teacher, to only ask questions...
Balanced Assessment
On Averages and Curves
Determine the average on a curve. The class finds graphical representations of averages and expresses them both symbolically and on the graph. The assessment requires class members to justify using average to describe graphs.
Balanced Assessment
Ford and Ferrari
Which is faster, a Ford or a Ferrari? The short assessment has pupils analyze graphs to determine the rates of change between the two. Individuals interpret the rates of change within the context of speeds of the cars and develop a map...
101 Questions
Slow Church
The church that just can't stay put! A video presentation raises questions of just how far the church will move. Presented with the rate of movement and a range of time expected, scholars build an inequality to answer the question.
Curated OER
Line Graph: To Grandmother's House We Go
In this line graph worksheet, students use a line graph showing distance traveled to answer a set of 4 related questions. Answers are included on page 2.
Curated OER
The Babylonian Algorithm, Limits and Rates of Change
In this successive approximations worksheet, students use the Babylonian algorithm to determine the roots of given numbers. They identify the limits of a function, and compute the rate of change in a linear function. This two-page...
Curated OER
Discovering Different Types of Functions
Graph polynomials and identify the end behavior of each polynomial function. The class differentiates between linear, quadratic, and other polynomial equations.
Mathematics Assessment Project
Middle School Mathematics Test 4
Raise expectations in your classroom and assess learners through the provided performance tasks. Class members must apply concepts learned throughout the year, providing a good measurement of how well they understand the material. The...
101 Questions
Scrambler
Unscramble a carnival mystery! Scholars observe a video of an overhead view of a carnival ride, The Scrambler. They then must determine mathematically where a specific car will stop after a certain amount of time.
Noyce Foundation
Snail Pace
Slow and steady wins the race? In the assessment task, scholars calculate the rates at which different snails travel in order to find the fastest snail. Hopefully, your class will move much more quickly in finishing the task!
Curated OER
Graphing Linear Equations with Two Variables
Can your class solve linear equations in two variables? They will be able to after they engage in this lesson. Individuals graph linear equations in two variables using slope and intercept and identifying the relationship between the x...
Los Angeles County Office of Education
Assessment For The California Mathematics Standards Grade 6
Test your scholars' knowledge of a multitude of concepts with an assessment aligned to the California math standards. Using the exam, class members show what they know about the four operations, positive and negative numbers, statistics...
Curated OER
The 100 Meter Race Problem
In this meter worksheet problem, students read a word problem and interpret a graph. They use the derived information to determine time and distance. This one-page worksheet contains 1 multi-step problem. Answers are provided at the...
Curated OER
Average and Instantaneous Velocity
In this velocity worksheet, students determine the average velocity for a trip, graph the distance traveled as a function of time, estimate the slope and identify the instantaneous rate of change of the function. This two-page worksheet...
Curated OER
Velocity and Acceleration
Compliment your physics lesson with this PowerPoint which demonstrates many important points regarding acceleration and velocity. A starter experiment activity to stimulate student thinking is given, and may prove very interesting to a...
Curated OER
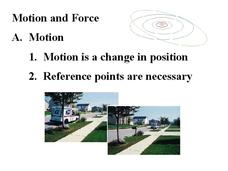
Motion and Force
All the main concepts in motion and force are covered in this presentation. Each slide is a great summary and will appeal to your students with a clean design and images that should seem relevant. Definitions of speed, displacement,...
Curated OER
Time and Rate
In this rate graphing worksheet, students graph four examples of rate vs. time. Then students complete 20 short answer questions.
Curated OER
Slope of a Line
In this slope of a line instructional activity, students read about line graphs and plotting the slope of a line. They read about the rate of change which is represented by the slope. Students practice finding the slope of lines.
Curated OER
Math: Currency Exchange Rates
Sixth graders apply the division and multiplication of decimals to convert dollars to various international currencies. In a travel simulation activity, they convert money, distance, and temperatures. During their "trip," students...
Mr. E. Science
Motion
An informative presentation covers motion, metric system, conversions, graphing of coordinates and lines, speed, velocity, and acceleration problems, as well as mean calculations. This is the first lesson in a 26-part series.
Concord Consortium
All-in-All Problems
Graphs, functions, symbols, and more! Use these strategies to model everything from the flow of a river to the number of cars passing a toll booth. Presented differently but solved similarly, learners consider five different scenarios...
University of Colorado
Can Photosynthesis Occur at Saturn?
In the 19th activity of 22, learners determine if distance from a light source affects photosynthesis. Participants capture oxygen in straws and find that the amount of water the gas displaces is proportional to the rate of photosynthesis.
Illustrative Mathematics
Buying Bananas, Assessment Version
Practice with unit rates, proportions, and ratios when Carlos purchases an amount of bananas. Learners must interpret a graph to decide whether points on the same line represent similar proportional relationships. Use with lesson plans...


