Curated OER
Algebra II: Exponential Functions
Students investigate, describe, and predict the effects of parameter changes on the graphs of exponential functions; describe limitations on the domains and ranges of these functions; and examine asymptotic behavior.
Curated OER
Away we Go
Students work in groups to calculate the costs of a trip to Six Flags amusement park. In this domain and range instructional activity, students calculate the least and greatest amounts of money needed for tickets, food, souvenirs, and...
Curated OER
Final Exam Review: College Algebra
For this final exam review worksheet,s students solve systems of equations, polynomials and factor quadratic equations. They identify the slope of a line and write linear equations. Students use Cramer's rule, graphing,...
Curated OER
Graphing Logarithms
In this logarithms worksheet, students identify the domain and range of given logarithms. They sketch the graph on a coordinate plane. This four-page worksheet contains 12 multi-step problems. Answers are provided on the last two pages.
Virginia Department of Education
Linear Modeling
An inquiry-based algebra instructional activity explores real-world applications of linear functions. Scholars investigate four different situations that can be modeled by linear functions, identifying the rate of change, as...
University of North Texas
Reading Graphs
There is more to the eye than just a graph on paper. The presentation shows three different piecewise graphs and asks an assortment of questions. The resource includes topics such as domain and range, intervals of increasing and...
Curated OER
Worksheet 11
In this math worksheet, middle schoolers define a function f(x) by the following rule: for any x ∈ R,set. They also define the domain and range for the functions.
Curated OER
Chapter 5 - Objective 5.1 Linear Equations
In this linear equations worksheet, students graph linear equations and identify the domain and range of each function. This one-page worksheet contains five problems.
Curated OER
ESP Quiz 2
Students solve five short answer (computation) problems, with three sets of instructions. Two problems require students to find the domain or range of a function. They evaluate limits problems, making proper use of limit notation for the...
Curated OER
Decode Word Is..
Students solve problems using patterns. In this algebra lesson plan, students identify the relation, domain and range of a function. They graph functions using coordinate pairs.
Curated OER
Algebra II Test Sections 2.4
In this algebra worksheet, students identify the slope of a line, solve algebraic equations with absolute value, and identify the domain and range of given functions. This three-page worksheet contains 21 problems.
Curated OER
Parabolic Equations
In this parabolic instructional activity, students write an equation of a parabola which satisfies given conditions. They match equations to the correct graph. Students identify the vertex, domain and range of an equation. This...
Curated OER
Power Function Inverses
Pupils graph polynomial functions and analyze the graphs. They identify the inverse of the functions and find the domain and range. Learners will then label the functions as one to one and use the horizontal and vertical line test to...
Curated OER
Functions and Relations
In this algebra activity, students calculate the solution to a function using substitution. They determine if a relation is a function or not. There are 34 questions on this test about Functions.
Embedded Math
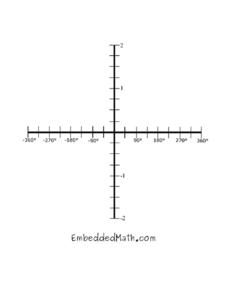
Trig Graph
You and your learners will enjoy having many copies of this trigonometric graph set on the Cartesian coordinate grid with a domain running from -360 degrees to 360 degrees and a range running from -2 to 2.
Curated OER
PreCalculus Test 3: Angle Measurement
In this angle measurement worksheet, students identify the domain and range of given problems. They determine the amplitude, period and horizontal translation of given functions. This two-page worksheet contains 16 problems.
Curated OER
Functions
In this Algebra I/Algebra II worksheet, students evaluate functions. Students graphs functions and determine the domain and range, find the sum, difference, and product of functions, find composite functions and explore the...
Curated OER
Functions and Their Graphs.
Students solve equations and label it as a function or not. In this algebra lesson, students make a table of values and graph their equation. They identify the domain and range of each graph.
Teach Engineering
Coordinates and the Cartesian Plane
The plot thickens to get a functional understanding. After a short review of plotting points on the coordinate plane, class members learn the difference between functions and relations in the second lesson in a series of nine. They...
Illustrative Mathematics
Transforming the graph of a function
This activity guides learners through an exploration of common transformations of the graph of a function. Given the graph of a function f(x), students generate the graphs of f(x + c), f(x) + c, and cf(x) for...
Howard County Schools
Drawing Inverses
An Algebra II lesson draws the connection between the exponential function and its inverse. By graphing an exponential function and using tables and a calculator, students graph the logarithmic function. The plan comes with a...
Curated OER
Dog Days or Dog Years?
In need of some algebraic fun with real world implications?Learners use ordered pairs, a table of values and a scatter plot to evaluate the validity of several real world data sets. The class focuses on dog ages in human...
Curated OER
Analyzing Data Sets
In this analyzing data sets worksheet, 11th graders solve and complete 35 various types of problems that include the analysis of data given. First, they determine the equation that best describes the data shown in a table. Then, students...
Curated OER
Domian and Range of Graphs
High schoolers determine the domain and range of various graphs using a graphing calculator. Given a set of graphs to analyze, learners calculate the range and domain of the graphs by plotting the graphs on their calculators. Downloads...


