Curated OER
Gold-Worthy Ideas for the Upcoming Games
Gather some ideas for bringing the Winter Olympics into your classroom.
Curated OER
China's Population Growth
Learners collect data from China's population growth and determine the mean, median, and mode from the data. In this data lesson plan, pupils determine probabilities and use them to make predictions.
Curated OER
Predicting Temperature: An Internet/Excel Learning Experience
Third graders use the Internet (www.weather.com) to find the high temperature for our locale and the high temperature for another city around the world. They keep track of the temperature in these two locations for 10 days.
Curated OER
Childhood Obesity
Students identify a question to generate appropriate data and predict results. They distinguish between a total population and a sample and use a variety of methods to collect and record data. Students create classifications and ranges...
Curated OER
Plant a Seed of Kindness
Students perform acts of kindness. In this character lesson, students cut out seed shapes and write down their acts of kindness on them. Students place the seeds on a bulletin board where they "plant" them below the grass line.
Curated OER
How Does it Affect Plants?
Middle schoolers examine the effects of acid rain on plants. They observe the growth of seeds and the health of different plants for a month. They share their findings with the community.
Curated OER
It's a Fact!
Second graders participate in a variety of activities to master addition and subtraction facts.
Curated OER
It's a Fact!
Second graders investigate the concept of addition and subtraction while manipulating a variety of different resources. They focus upon the use of the games in order to keep student engagement. Then students are given the opportunity to...
Curated OER
Power Point -- Science Portfolio
Students are introduced to Microsoft PowerPoint. Using the internet, they research a topic of interest to them related to science. They create three slides and share them with the class. They also discover how to print the slides and...
Curated OER
Take a Survey!
Second graders discuss proper uses of the Internet. They complete the 8-question survey by selecting their favorite answer for each question. They click one time in the white circle to choose an answer and click Next at the bottom on...
CK-12 Foundation
Ck 12: Statistics: Double Bar Graphs Grade 6
[Free Registration/Login may be required to access all resource tools.] Create double bar graphs to display and compare given data.
CK-12 Foundation
Ck 12: Statistics: Double Bar Graphs Grades 9 10
[Free Registration/Login may be required to access all resource tools.] Covers double bar graphs.
Shodor Education Foundation
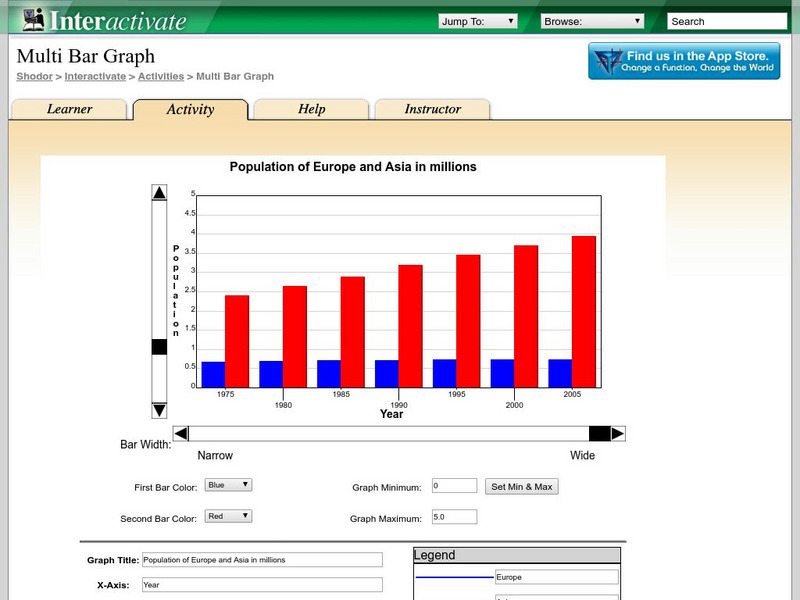
Shodor Interactivate: Multi Bar Graph
The interactive learning activity allows students to manipulate a double bar graph. Teacher resources are included.
Cuemath
Cuemath: Bar Graphs
A comprehensive guide for learning all about bar graphs with definitions, solved examples, and practice questions.
Khan Academy
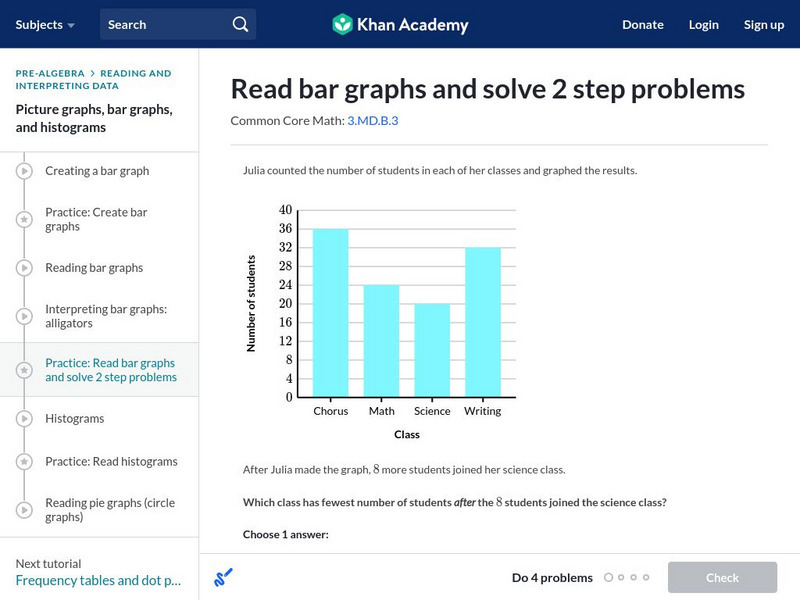
Khan Academy: Read Bar Graphs and Solve 2 Step Problems
Read and interpret a double bar graphs. Students receive immediate feedback and have the opportunity to try questions repeatedly, watch a video or receive hints. CCSS.Math.Content.3.MD.B.3 Draw a scaled picture graph and a scaled bar...
Texas A&M University
Wtamu Virtual Math Lab: Beginning Algebra: Reading Graphs
A good introduction to reading bar, line, and double line graphs, and drawing and reading Venn diagrams. Contains definitions and examples of these types of charts and graphs as well as practice exercises that ask you to answer questions...
ClassFlow
Class Flow: Graphs
[Free Registration/Login Required] This flipchart presents bar and double bar graphs, line and double line graphs, pictographs, histograms, and circle graphs with review activities and web links for practice.
University of Cambridge
University of Cambridge: Nrich: The Pet Graph
On this one-page website, sharpen your logic and graph reading skills by figuring out which pet goes with each bar on the graph. The solution is available to double check your own solution.
National Council of Teachers of Mathematics
Nctm: Figure This: Census
Try this real world challenge that focuses on data collection, data analysis, and problem solving with information from the U.S. Census Bureau. Discover how these skills are applied in real life situations in this one page activity from...
Other
Stat Soft: Statistics Glossary
Dozens of statistical terms are defined and illustrated in this glossary.
Other popular searches
- Double Bar Graph Activities
- Reading Double Bar Graphs
- Double Bar Graph Assessment
- Creating Double Bar Graphs
- Definition Double Bar Graph
- Double Bar Graph Worksheets
- Double Bar Graphs Ell
- Double Bar Graphs Animals
- Double Bar Graphs Enrichment
- Double Bar Graphs Reteach
- Double Bar Graphs Worksheets
- Double Bar Graph Table


