Curated OER
Favorite Survey
Fourth graders collect and organize data for charts and bar graphs by questioning their classmates. They utilize a worksheet imbedded in this plan which guides them through their 'favorites' survey.
Curated OER
Water and Land 207
Students examine maps of different projections, mathematically calculate distortions, and note the advantages and disadvantages of each map. They study the different maps and transfer the map to graph paper.
Curated OER
Geometric Transformations and Tessellations
In this geometry worksheet, 10th graders create a polygon in the indicated quadrant of a graph and perform the indicated transformation. Students create an Escher type transformation. The one page worksheet contains four questions. ...
Curated OER
Gold-Worthy Ideas for the Upcoming Games
Gather some ideas for bringing the Winter Olympics into your classroom.
Curated OER
Predicting Temperature: An Internet/Excel Learning Experience
Third graders use the Internet (www.weather.com) to find the high temperature for our locale and the high temperature for another city around the world. They keep track of the temperature in these two locations for 10 days.
Mathematics Vision Project
Quadratic Equations
Through a variety of physical and theoretical situations, learners are led through the development of some of the deepest concepts in high school mathematics. Complex numbers, the fundamental theorem of algebra and rational exponents...
Noyce Foundation
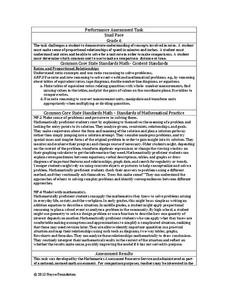
Sewing
Sew up your unit on operations with decimals using this assessment task. Young mathematicians use given rules to determine the amount of fabric they need to sew a pair of pants. They must also fill in a partially complete bill for...
Howard County Schools
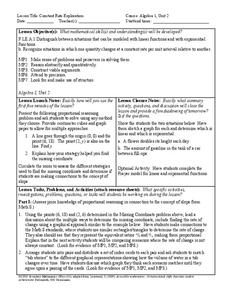
Constant Rate Exploration
Question: What do rectangles and bathtub volume have in common? Answer: Linear equations. Learn how to identify situations that have constant rates by examining two different situations, one proportional and one not proportional.
CPM
Direct, Joint, and Inverse Variation
Here is a quick guide to direct, joint, and inverse variation used in realistic situations. Each topic has a page of notes and examples followed by practice problems. The resource explains each type of variation and provides their...
Liberty High School
Science Department Lab Report Format
Make sure your scientists are reporting their work effectively by providing them with a reference for their lab reports. The first few pages of this resource detail each element of a lab report, and the last few pages provide an example...
Curated OER
Childhood Obesity
Students identify a question to generate appropriate data and predict results. They distinguish between a total population and a sample and use a variety of methods to collect and record data. Students create classifications and ranges...
Noyce Foundation
Snail Pace
Slow and steady wins the race? In the assessment task, scholars calculate the rates at which different snails travel in order to find the fastest snail. Hopefully, your class will move much more quickly in finishing the task!
PBL Pathways
College Costs 2
What is the financial benefit for attending a community college for the first two years before transferring to a four-year college? The second part of the educational lesson asks young scholars to explore this question through data...
Curated OER
Calculus Games
In this calculus learning exercise, students rewrite a word problem using algebraic symbols and calculate the derivative of a function to find the correct solution. There are 20 matching questions with an answer key.
Curated OER
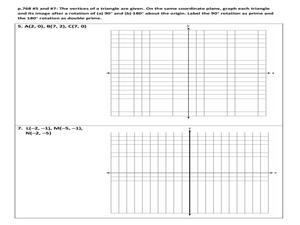
Transformations
In this geometry worksheet students rotate, reflect, and translate geometric shapes. The four page worksheet contains seventeen problems Solutions are not provided.
Curated OER
Charles's Law
In this Charles's Law learning exercise, students review the Kelvin temperature scale, how volume varies with temperature, and Charles's Law. This learning exercise has 4 problems to solve.
CK-12 Foundation
Ck 12: Statistics: Double Line Graphs
[Free Registration/Login may be required to access all resource tools.] Construct and interpret double line graphs.
Texas A&M University
Wtamu Virtual Math Lab: Beginning Algebra: Reading Graphs
A good introduction to reading bar, line, and double line graphs, and drawing and reading Venn diagrams. Contains definitions and examples of these types of charts and graphs as well as practice exercises that ask you to answer questions...
ClassFlow
Class Flow: Graphs
[Free Registration/Login Required] This flipchart presents bar and double bar graphs, line and double line graphs, pictographs, histograms, and circle graphs with review activities and web links for practice.
Better Lesson
Better Lesson: The Double Number Line
The double number line will help students figure out problems that involve two quantities.
University of Cambridge
University of Cambridge: Nrich: Graphing Number Patterns
On this one page website sharpen your logic, graphing and pattern recognition skills while working on this challenge. The solution is available to double check your solution.
Common Core Sheets
Common Core Sheets: Ratios and Proportional Relationships 6.rp.3b Worksheets
Print or create worksheets or flashcards to assess students' understanding of ratios and unit rates.
Oswego City School District
Regents Exam Prep Center: Linear Inequalities
A complete review of linear inequalities interval notation, and compound inequalities. Several applications of the compound inequalities are given along with solutions and explanations. Links to sites assisting with graphing calculator...


