Concord Consortium
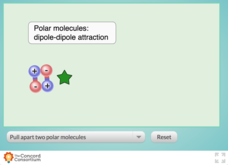
Comparing Dipole-Dipole to London Dispersion
Which intermolecular force is the strongest? Scholars test the relative strength of London dispersion forces, dipole-dipole interactions, and induced dipoles using a simulator. The interactive allows learners to pull on paired molecules...
Corbett Maths
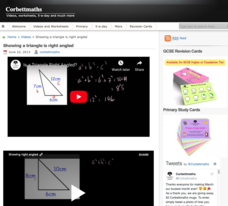
Showing a Triangle Is Right Angled
Determine whether it is right or not. Using the Pythagorean Theorem, the video shows how to determine whether a triangle is a right triangle. Pupils practice the skill in a few of the problems in the associated worksheets on the...
Curated OER
Risk Assessment and Geometry
Tenth graders study the concept of risk analysis as it relates to geometry. For this spatial relationship lesson, 10th graders are provided a set of coordinates to analyze a piece of land described. Students write a description that...
Curated OER
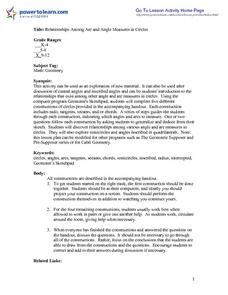
Relationships Among Arc and Angle Measures in Circles
Students follow the directions on the attached worksheet to construct shapes using Geometer's Sketchpad. To start the lesson, it is suggested that the teacher guide the students through the initial problem. When constructions are...
Curated OER
OSAE Can You See
Students observe, speculate, analyze and evaluate conclusions about Mississippi River locations as well as illustrate their findings in drawings. They enhance themselves with their surroundings and landscape pictures at various places...
Curated OER
Local and National News
Young scholars work together in small groups, negotiate, plan, summarize, analyze, read and understand, speak so others can understand, cooperate with others, and listen critically. Students use local newspapers to draw their...
Curated OER
Blade Design of Windmills
In this engineering worksheet, 9th graders experiment with the design of a windmill blade to generate more electricity by creating a step by step plan, drawing a diagram, recording data from trials, write a conclusion and a comparison of...
Curated OER
Statistical Sampling
Students collect data in the field and analyze it in class using tables and graphs to determine how many observations of a phenomenon are necessary to draw valid conclusions.
Curated OER
Science Happens in a Social Context
Students discuss how the same data is viewed differently between historians and scientists. Using the data, they compare and contrast the vocabulary used and the focus of attention. They analyze the conditions that help spread diseases...
Curated OER
Measuring the Speed of a Wave
Students create an experiment in which they measure the speed of a wave and record the data in a graph. They work in small groups to write the procedure for the experiment and share it with another group for cross checking of the...
Curated OER
Math and Cinderella
Pupils trace their feet and them compare the different sizes of classmates. They construct a bar graph showing the results of their classmates' feet size. They discuss what kinds of conclusions can be drawn from their observations.
Curated OER
"Charlotte's Web" - Transfer of Learning Across the Curriculum: From Literature to Science
Students research and write about the parts of a spider's body using educational software. They draw spiders using computer software.
Curated OER
How Do We Learn About the Past?
Sixth graders discuss the role of an archaeologist as a class. After viewing photographs, they relate the objects found in their local area and Ancient Egypt. They draw a picture of an object that represents their own culture and gives...
Curated OER
The Three Gorges Dam- Should it be Completed?
Students research and analyze the geographic problem of whether or not the Three Gorges Dam should be completed. Students take a position on the issue, gather information related to their position, present their conclusions, and write a...
Curated OER
Serach for the Lost Cave People
Students examine primary source documents to draw inferences about 17th century American colonists.
Curated OER
Spring Collecting and Identifying Bumble Bees
Students collect bumble bees in the field, record data, identify and release specimens, answer conclusion questions, and send data in to researcher leaders. They make research based conclusions based upon the evidence.
Curated OER
The Bill of Rights Today
Students examine the Bill of Rights, They read the Bill of Rights and clarify the meaning of the material using different reading strategies. In groups, students brainstorm to compare and evaluate their conclusions with those of others.
Curated OER
Spring Collecting and Identifying Bumble Bees
Young scholars collect bumble bees in the field, record data, pin and label specimens, answer conclusion questions, and send specimens to research leaders for verification. They improve their ability to work in research teams. Students...
Curated OER
Scientific Inquiry: Periodic Motion
Students construct their own pendulum. In this physics activity, students design an experiment to find the factors affecting its period. They formulate a conclusion based on experimental data.
Curated OER
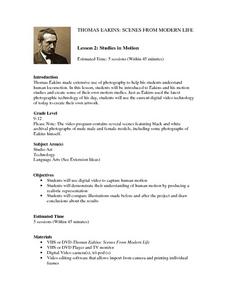
Thomas Eakins: Scenes From Modern Life Lesson 2: Studies in Motion
Young scholars investigate the motion studies of Thomas Eakins. They design motion studies as Eakins did using photography. They use digital photography to capture human motion and draw a representation.
Curated OER
Froggy Fun
Students exploring about frogs and their environment. They describe what camouflage is and why it is useful to frogs especially in the environment that frogs live in. They also draw a picture of a frog in its habitat.
Curated OER
Oil in Oman 224
Students discuss the impact of oil on the economics and culture of Oman. They make a chart showing life before and after oil/petroleum wealth in Oman and its capitol city, Muscat. They draw scenes showing Muscat before and after,...
Curated OER
Pathways to the Future
Students draw a pathway and create a movement phrase along that same path using specific movement vocabulary. The phrases are performed in class and rubrics are used for assessment. Meets State standards for the arts.
Curated OER
Hazard Alert
Students examine data regarding the occurrence of natural hazards as they occur in the United States. They record data on a classroom chart, map the areas affected by the hazards, and analyze and discuss conclusions drawn from the...
Other popular searches
- Nonfiction Draw Conclusions
- Draw Conclusions in Reading
- Draw Conclusions Lesson
- Draw Conclusions Reading
- How to Draw Conclusions
- Infer and Draw Conclusions
- Draw Conclusions in Literacy
- Draw Conclusions in Fiction
- Fiction Draw Conclusions
- Draw Conclusions Worksheet


