Curated OER
A Tree is a Friend
Fifth graders discover the value of trees in our society. In this ecosystem instructional activity, 5th graders read the book, A Tree is Nice, and discuss with classmates how trees are essential to our existence due to creating oxygen...
Curated OER
Infusing Equity in the Classroom by Gender
Students investigate the idea of gender descrimination in the classroom. For this algebra lesson, students collect data in stereotyping, and gender bias in the classroom, school materials and activities. They graph and analyze their...
Curated OER
Glacier Dynamics
Students create flubber glaciers. In this glacier dynamics lesson, students experiment factors that may affect glacier speed. Factors include slope, ice temperature, and basal conditions. Students develop hypothesis, conduct experiment,...
Curated OER
Fishing Fun
Students complete pre reading, writing, during reading, and interdisciplinary activities for the book Fishing Fun. In this reading lesson plan, students complete journal entries, go over vocabulary, answer short answer questions, have...
Curated OER
Memories to Last: Observing Monuments
Students use scientific observation and inference to examine the Hazen Brigade Monument. In this observation lesson, students review the reasons for building monuments in society. Students then recall monuments they have seen and draw...
Curated OER
More Power to You
Students explore renewable and nonrenewable energy sources and develop a documentary that explores multiple energy sources and draws conclusions about their uses.
Curated OER
Meet Your Partners
Young scholars become student scientists and work with Internet partners to collect, share, and analyze data needed to draw conclusions about the Waipi'o Valley Stream Restoration.
Curated OER
Measuring the Impact of Exercise And Body Position (laying Down, Sitting And Standing) on Heart Rate
Seventh graders gather data on heart rate during exercise and at rest in three different positions. They compute male and female averages for each different heart rate and graph each and draw conclusions based upon the data about the...
Curated OER
A Hair Raising Experience
Fifth graders conduct an investigation using glass, metal ,fur, latex balloon, plastic bag and hair to generate static electricity of varying amounts. They predict, observe, make comparisons, and draw conclusions about static electricity...
Curated OER
Why Muscle Biology?
Students research and define a muscle biology research question and organize an experiment to address the question utilizing either NADH staining or acid buffering. They analyze data as well as draw conclusions about their research....
Curated OER
Adhesives: How Sticky is Your Tape?
Students test the adhesive strength of different tapes. In this adhesive lesson plan, students conduct an experiment to test the shear strength of the adhesives, take measurements, record data, and draw conclusions to explain each...
Curated OER
Why is The Sky Blue?
Young scholars explore why the sky is blue. In this light instructional activity, students conduct an experiment using water, flashlights, and milk to test why the sky is blue. Young scholars view a PowerPoint, take notes on their...
Curated OER
Graphing Surveys
Students collect data and graph it. In this algebra lesson plan, students create a survey for their classmates and teachers. They analyze the results from the survey and graph it. They draw conclusion from their data based on the graph.
Curated OER
Graphs
Students explore graphs and define the different ways they are used to display data. In this algebra lesson, students collect data and plot their data using the correct graph. They draw conclusions from their graphs based on their data.
Curated OER
Mountain Barriers
Students examine geographical change. In this mountain barriers lesson, students conduct an experiment to discover how mountains affect surrounding land. Students draw conclusions on how change in land affects plant and animal life.
Curated OER
Measurement of Biotic and Abiotic Objects
Learners identify biotic and abiotic factors. In this environmental study lesson, students conduct a series of experiments to collect and record data and draw conclusions based on the results.
Curated OER
Mixtures of Matter
Young scholars experiment with solids and liquids. In this mixtures of matter lesson plan, students combine matter to form solutions. Young scholars hypothesize, test, and analyze the data to draw conclusions. The lesson plan can be...
Curated OER
Surface Water and Groundwater
Students examine distribution of water and minerals. In this surface and groundwater lesson, students conduct an experiment with fresh and salt water making hypothesis and drawing conclusions about minerals.
Curated OER
African Clothing
Students explore African clothing. In this African culture social studies lesson, students brainstorm types of clothing they wear for different occasions. Students view photographs of Africans wearing Western clothing and "special...
Curated OER
Using My Nasa Data To Determine Volcanic Activity
Students use NASA satellite data of optical depth as a tool to determine volcanic activity on Reunion Island during 2000-2001. They access the data and utilize Excel to create a graph that has optical depth as a function of time for the...
Curated OER
Esperanza Rising - Literature Circles and Review (Day 3)
Kids love working with their peers. Get your class into small literature circles and have them complete weekly assignments. Before beginning this week's activity, have each learner write a letter from Esperanza in California to Abuelita...
Discovery Education
Sonar & Echolocation
A well-designed, comprehensive, and attractive slide show supports direct instruction on how sonar and echolocation work. Contained within the slides are links to interactive websites and instructions for using apps on a mobile device to...
Curated OER
Data Analysis Using Technology
Analyze data using technology. Middle schoolers design data investigations, describe data, and draw their own conclusions. Then they select the best type of graph, graph and interpret the data, and look for patterns in trends. They also...
National Wildlife Federation
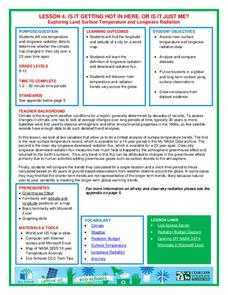
Is It Getting Hot in Here, or Is It Just Me?
Currently, only 2.1% of global warming is felt on continents, while over 93% is felt in the oceans. The fourth lesson in the series of 21 on global warming is composed of three activities that build off one another. In the first...


