Curated OER
Math Made Easy
Young scholars evaluate word problems. In this problem solving lesson plan, students are presented with word problems requiring graphing skills and young scholars work independently to solve.
Curated OER
What are the Issues?
Seventh graders complete political analysis activities. In this political analysis lesson, 7th graders discuss party platforms and research party issues for their party's candidate's positions. Students complete an issues organizer and...
Curated OER
Arriba Amigos!
Students explore how culture effects our world. In this culture lesson, students work in groups to do a web quest. Students gather and analyze information to decide if Mayan ruins should be destroyed to build a shopping center. Students...
Curated OER
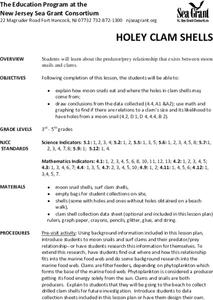
Holey Clamshells
Students analyze data to make hypotheses and conclusions regarding the predator/prey relationship between moon snail and surf clams.
Curated OER
Float Your Boat
Students investigate buoyancy, displacement and density. For this flotation lesson students study the Archimedes' Principle, analyze data and draw conclusions.
Curated OER
The Aging Population of Canada
Students analyze age-group population data and make inferences on the impact of the aging population in Canada. They, in groups, focus on health care, social programs and labor issues.
Curated OER
Balloon Ball Bounce
Students explore the rebound of balls. In this energy conversion lesson, students explore the physics behind the rebound of various types of sports balls. Through the experimental design process using balloons, students investigate and...
Curated OER
Literacy as a Force in the World
Students research and compare economic factors and data mining in Nepal. Students look at data to determine how the Nepalese quality of life compares to other countries and predict whether the literacy rate indicates or influences the...
Curated OER
Identifying potential target markets
Students analyze data. In this secondary mathematics lesson, students identify the demographic, geographic, and socio-economic characteristics of potential target markets for planned goods and services. Students identify and compare...
Curated OER
Investigating the Probability
Learners investigate probability using coins and dice. They collect data, graph, organize and interpret data. They predict, describe, compare, compute and draw conclusions based on what they observe and record.
Curated OER
Ohio Census 1990 and 2000
Students explore the Ohio census numbers in 1990 and 2000. In this social studies lesson plan, students use the census data to answer questions.
Curated OER
Harry Potter Research Project
Students work together to complete a research project on Harry Potter. They write a research question and develop a survey to give to their classmates. Using the results, they create a graph and draw conclusions about the data collected.
Curated OER
Charting and Graphing Sales
Students analyze and represent weekly sales figures using tables, bar graphs, and pie charts. They draw conclusions using bar graphs and pie charts. Students are told that each day at school they have the option of buying or bringing a...
Curated OER
Condiment Diver: The World's Simplest Cartesian Diver
Middle schoolers examine buoyancy. In this density lesson students form a hypothesis, collect data and draw a conclusion using the data.
Curated OER
Tune...Um!
Students collect real data on sound. For this algebra lesson, students use a CBL and graphing calculator to observe the graph created by sound waves. They draw conclusion about the frequency of sound from the graph.
Space Awareness
The Thermal Layers of Oceans
How much does the sun heat up a lake or ocean? Scholars use a cup and a strong lamp to investigate the heat transfer and thermal layers in the ocean to come up with the answer. They collect data and graph it in order to better understand...
Curated OER
Deep Freeze
Students practice various sampling methods for retrieving data under water, ice, and soil. They use the sample material to make temperature measurements, chart contents, and draw their own conclusions as to what is happening in the...
Curated OER
Science Lab Skills
Students develop problem solving, decision-making and inquiry skills by planning experiments. They conduct systematic observations, interpret and analyze data and draw conclusions then communicate their results.
Curated OER
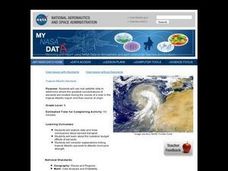
Troical Atlantic Aerosols
Students explore the effect aerosols have upon he weather and climate. They observe NASA satellite images to explore and draw conclusions about aerosol transport. From studying the images, students track the path of aerosols. They...
Illustrative Mathematics
Mr. Brigg's Class Likes Math
A quick discussion question that brings some collaboration into your classroom will allow your thinkers to make a decision about sampling. Mr. Briggs wants to know if the results from his class are a valuable comparison to the entire...
Curated OER
There's a Place That Has a Race
Students define the term "place," collect data about Alaska and the Iditarod from several web sites, take online quiz using information gathered, and draw conclusions based upon their data collection and analysis.
Curated OER
Is Your Water Clean?
Students compare water quality of different sources. They test water samples for odor, phosphates, pH, bacteria, and dissolved solids. they fill out a data table and answer questions about their findings.
Curated OER
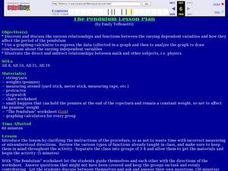
The Pendulum
Students discover and discuss relationships and functions between varying dependent variables and how they affect the period of the pendulum. They use graphing calculator to express the data collected in a graph, to analyze the graph,...
Curated OER
How Strong Is It?
Students investigate the adhesion conditions and surface for using post it notes. In this post it notes lesson plan, students discover the adhesive properties, test the notes for strength, and interpret data and draw conclusions.


