Curated OER
Probability
Sixth graders explore the concept of probability. In this probability lesson, 6th graders collaborate to collect spinner data based on the likelihood of spinning odd and even numbers. Students complete 2 other probability activities and...
Curated OER
Observations From the Past
Ninth graders explore direct and indirect evidence. In this astronomy lesson, 9th graders investigate the contribution of early astronomers to their field. They create a model of the solar system.
Curated OER
Voting Then and Now
Students consider the impact of the Voting Rights Act as they examine voting practices today. In this voting lesson, students research details regarding the Voting Rights Act and then read a handout regarding voting data from the early...
Curated OER
The Heart Stopper
Use the pump from a spray bottle to drive a model of the heart in action! In addition to modeling the function of the heart and blood vessels, aspiring anatomists also simulate arterial blockage. They compare the effects of increased...
Curated OER
Making a Thermometer
Students observe a demonstration of how a thermometer functions. They apply the scientific method while determining which of three cups hold the coldest water. They write a hypothesis before conducting the experiment and gather data.
Curated OER
Campaign Signs and Pranksters
Students collect campaign literature and investigate what signs local candidates are using. Students contact local politicians/candidates and interview them about the concepts and creation of their campaign literature. Students compare...
Curated OER
Soil Nutrients - Phosphorus Lab Lesson Plan
Students list sources of phosphorus in soil. They explain how phosphorus is removed from the soil and used by plants. Students list the symptoms of insufficient or excess phosphorus. Students perform experiments to examine the effect of...
Curated OER
Compass Deviation
Learners identify and describe the difference between the magnetic north pole and true north. They consider why sailors could not steer a straight course to the New World from the Old.
Curated OER
Amphipod Ecology
Pupils count amphipods under kelp wracks of varying ages to explain how long it takes for them to find their food source. They collect and represent the data.
Curated OER
Are We Alone
Seventh graders collect/analyze data and draw conclusions; support reasoning by using a variety of evidence; construct logical arguments; access information at remote sites using telecommunications; apply the concept of percent;...
Curated OER
WEATHER SATELLITE PREDICTION PROJECT
Students compile weather satellite data from three satellites for one month, obtain weather reports and data from professionals, then create a document with predicted results.
Curated OER
Spring Collecting and Identifying Bumble Bees
Students collect bumble bees in the field, record data, identify and release specimens, answer conclusion questions, and send data in to researcher leaders. They make research based conclusions based upon the evidence.
Curated OER
Hazard Alert
Students examine data regarding the occurrence of natural hazards as they occur in the United States. They record data on a classroom chart, map the areas affected by the hazards, and analyze and discuss conclusions drawn from the...
Curated OER
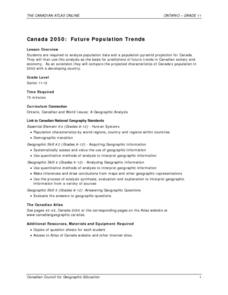
Canada 2050: Future Population Trends
Students analyze population data and a population pyramid projection for Canada. They make predictions of future society and economic trends.
Curated OER
A Real Difference
Fifth graders use the Celsius and Fahrenheit thermometers to compare temperature readings. They use the Internet to find the temperatures of selected cities. After data is collected for five days, 5th graders graph the temperatures.
Curated OER
Who We Are
Students analyze population data and trends in Canada over a given amount of time. As a class, they are introduced to the concept of dependency load and use a population pyramid to calculate the figure. Using the internet, they...
Curated OER
Canada 2050: Future Population Trends
Pupils analyze population data and a population pyramid projection for Canada. Using this information, they predict what the future trends in the population might be and its effect on Canadian society as a whole. They compare and...
Curated OER
Graph it!
Sixth graders view a Stacked Graph, and discuss what it shows. Students discuss the basics of graphing: labels, intervals, legends x and y axis... Students create individual stacked graphs from provided information. Students view a...
Curated OER
Soils, Water and Erosion
Students participate in a hands-on experiment to compare how water and soil erosion affect soil and grass. They determine how slope affects erosion and how terracing affects erosion. They write a paragraph summarizing their data.
Curated OER
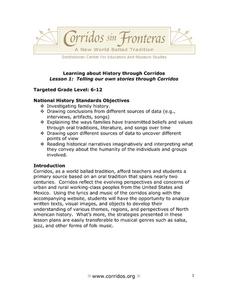
Passing Down Family History Through Oral Tradition: Corridos
Students create and perform Corridos which are oral tradition ballads. For this Passing Down Family History Through Oral Tradition lesson, students interview family members using a predetermined list of questions. In addition, students...
Foundation for Water & Energy Education
How is Flowing Water an Energy Source? Activity C
Can the force of falling water through a tube vary by altering the diameter of the tube or its height? That is what physical scientists aim to discover in this activity, the third in successively more revealing activities on the power of...
Center for Learning in Action
Density
Explore the concept of density within states of matter—gases, liquids, and solids—through a group experiment in which young scientists test objects' texture, color, weight, size, and ability to sink or float.
Curated OER
Mathematical Models with Applications: The Sounds of Music
Students use an electronic data-collection device to model the sound produced by a guitar string. They identify the graph of a periodic situation and use the graph to determine the period and frequency of sound waves.
Curated OER
Embracing Diversity
Ninth graders discover that the amount surveyed affects the results and conclusions drawn from a survey. In this sampling lesson plan students explore the concept that a valid conclusion require a large number of entries. Students...


