Chemical Education Foundation
Teacher's Guide to Science Projects
Do you find the idea of having a science fair with all of your students intimidating? Use a guide that provides everything you need to know to make project-based learning manageable. The resource includes options for four different types...
Curated OER
Mean and Standard Deviation
Get two activities with one lesson. The first lesson, is appropriate for grades 6-12 and takes about 20 minutes. It introduces the concept of measures of central tendency, primarily the mean, and discusses its uses as well as its...
WK Kellogg Biological Station
Plotting Phenology
Finally, a worksheet that involves more than filling in some blanks. Your budding ecologists must graph and analyze three sets of data, then synthesize the information as they think about the impacts of plant reproduction on insects and...
Curated OER
Application and Modeling of Standard Deviation
The first activity in this resource has learners computing the mean and standard deviation of two different data sets and drawing conclusions based on their results. The second activity has them using a dice-rolling simulation to...
Inside Mathematics
Scatter Diagram
It is positive that how one performs on the first test relates to their performance on the second test. The three-question assessment has class members read and analyze a scatter plot of test scores. They must determine whether...
Inside Mathematics
Archery
Put the better archer in a box. The performance task has pupils compare the performance of two archers using box-and-whisker plots. The resource includes sample responses that are useful in comparing individuals' work to others.
Inside Mathematics
Suzi's Company
The mean might not always be the best representation of the average. The assessment task has individuals determine the measures of center for the salaries of a company. They determine which of the three would be the best representation...
Curated OER
Scientific Problem Solving
In this problem solving worksheet, students will conduct an experiment to answer this question: "How does watching too much television affect us?" Students will form a hypothesis, collect data, analyze their data, and draw a conclusion....
Curated OER
How Does the Angle Effect How Fast a Car Will Travel?
In this angle of movement and speed worksheet, students determine at which angle a car will travel the fastest. They test 12 different angles on a toy car and determine from their data which angle is the best for speed.
NASA
The Effects of Sunspots on Climate
In this sunspots and climate change learning exercise, learners use a diagram of a tree stump and its rings to determine the age of the tree. They use sunspot data from the internet and they construct an Excel spreadsheet to compare the...
Curated OER
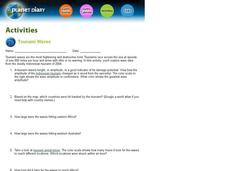
Tsunami Waves
In this tsunami waves worksheet, students explore data from the Indonesian tsunami of 2004 and answer ten questions about the data. They draw conclusions about the devastation and destruction based on the amplitude and speed of the tsunami.
Curated OER
How Do Astronomers Measure Distances to Stars?
For this astronomy worksheet, students participate in an activity using the parallax effect to measure star distances. They record their information in a data table then complete 5 fill in the blank conclusion questions.
Texas State Energy Conservation Office
Investigation: Kinetic and Potential Energy
A well-developed lab sheet guides physical science learners through an investigation of kinetic and potential energy. In small groups, collaborators discover whether or not the ramp height or mass of an object has an effect on the...
Noyce Foundation
Ducklings
The class gets their mean and median all in a row with an assessment task that uses a population of ducklings to work with data displays and measures of central tendency. Pupils create a frequency chart and calculate the mean and median....
Illustrative Mathematics
Mr. Brigg's Class Likes Math
A quick discussion question that brings some collaboration into your classroom will allow your thinkers to make a decision about sampling. Mr. Briggs wants to know if the results from his class are a valuable comparison to the entire...
Nevada Outdoor School
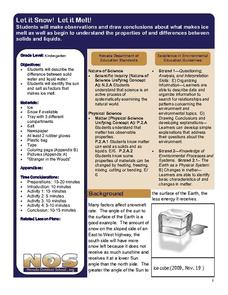
Let It Snow! Let It Melt!
Winter weather offers a great opportunity to teach young scientists about the states of matter. This activity-based lesson includes a range of learning experiences, from experimenting with the rate at which ice melts to singing a song...
Classroom Law Project
What does the Constitution say about voting? Constitutional Amendments and the Electoral College
As part of a study of voting rights in the US, class members examine Constitutional amendments connected with voting and the role of the Electoral College in the election process.
Inside Mathematics
Quadratic (2006)
Most problems can be solved using more than one method. A worksheet includes just nine questions but many more ways to solve each. Scholars must graph, solve, and justify quadratic problems.
Inside Mathematics
Swimming Pool
Swimming is more fun with quantities. The short assessment task encompasses finding the volume of a trapezoidal prism using an understanding of quantities. Individuals make a connection to the rate of which the pool is filled with a...
Curated OER
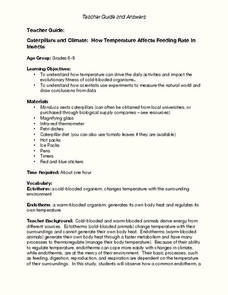
Caterpillars and Climate: How Temperature Affects Feeding Rate In Insects
Do you eat more when you are hot or when you are cold? Young scientists observe the eating pace of two caterpillars at different temperatures. The differences in endotherm and ecotherm animals' ability to adjust to temperature change...
Curated OER
Cumulative Frequency
In these word frequency worksheets, students choose a page from a newspaper and count the number of letters in each word and complete their results in a table. Students then calculate the mean number of letters. Students then collect...
Curated OER
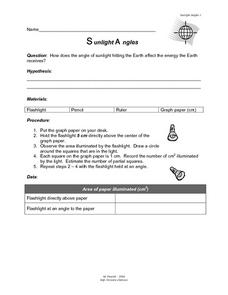
Sunlight Angles
In this sunlight worksheet, students solve the problem of how much energy the Earth receives from the different angles of the sun. Students collect data, chart it, and come up with a conclusion.
Teach Engineering
Earthquakes Living Lab: Geology and Earthquakes in Japan
Sometimes it seems as if earthquakes hit the same places over and over again. Class members study Japan in order to determine why earthquakes keep happening there. Pairs work together to research and try to determine whether there are...
Curated OER
Making Money and Spreading the Flu!
Paper folding, flu spreading in a school, bacteria growth, and continuously compounded interest all provide excellent models to study exponential functions. This is a comprehensive resource that looks at many different aspects of these...


