Kenan Fellows
Lego Thinking and Building
Run a simulated airplane manufacturing plant with your pupils as the builders! Learners build Lego airplane models and collect data on the rate of production, comparing the number produced to the number defective. Using linear...
Curated OER
A Closer look at Oil and Energy Consumption
Upper graders analyze basic concepts about the consumption, importation and exportation of the worlds oil production. They create several graphs to organize the data and draw conclusions about the overall use of oil in the world.
Baylor College
Body Mass Index (BMI)
How do you calculate your Body Mass Index, and why is this information a valuable indicator of health? Class members discover not only what BMI is and practice calculating it using the height and weight of six fictitious individuals, but...
Curated OER
The Good and Bad Bacteria
High schoolers are able to name one kind of harmful bacteria and why it hurts us and also name one kind of helpful bacteria and how we use it. They describe the process of growing bacterial cultures in a lab. Students create a reasonable...
US Environmental Protection Agency
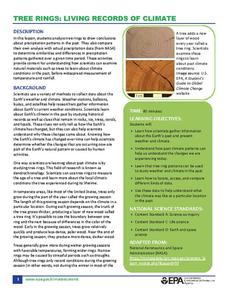
Tree Rings: Living Records of Climate
Open with a discussion on weather and climate and then explain how tree rings can provide scientists with information about the earth's past climate. Pupils analyze graphics of simulated tree rings from various US locations for the...
NASA
Determining the Nature, Size, and Age of the Universe
Prompt scholars to discover the expansion of the universe themselves. Using photographs of other galaxies, they measure and then graph the size and distance of each. Finally, they draw conclusions and prove the universe is expanding.
Ohio Department of Education
Observe Then Infer
To develop their skill at drawing inferences from observations, sixth graders rotate through six stations, conduct a series of experiments, make observations, and draw inference from what they observe.
Curated OER
World War II - War Comes to Hawaii
Ninth graders use geographic representations to organize, analyze, and present information on people, places, and environments. They use tools and methods of geographers to construct, interpret, and evaluate qualitative and quantitative...
Space Awareness
Continental Climate and Oceanic Climate
There's nothing better than a cool breeze blowing in from the ocean. Scholars explore how water affects change in temperature using a hands-on experiment on climate. They use measurement tools to compare the continental and oceanic...
Kenan Fellows
Using Water Chemistry as an Indicator of Stream Health
Will this water source support life? Small groups test the chemistry of the water drawn from two different sources. They then compare the collected data to acceptable levels to draw conclusions about the health of the source. The...
PHET
Mapping the Field of Multiple Dipole Magnets
So you built a magnetometer, now what? High school scientists use their magnetometer made in a previous lesson plan to map the union of magnetic fields of dipole magnets. They experiment with different alignments and draw conclusions...
Curated OER
Popcorn Is a Gas
Students investigate why and how popcorn pops. In this gas lesson plan, students observe and make suggestions as to what causes popcorn to pop after observing popped corn and corn kernels. Students mass the kernels before and after...
Curated OER
FCAT Real World Solving Linear Equations/Systems
Pupils relate real life situation to the equations, graphs and inequalities. They model real life scenarios using matrices and draw conclusions from their data. This lesson plan is aligned with FCAT.
Curated OER
Circles Minilab
Students learn how to measure the diameter and circumference of a circle. For this circle lesson, students organize their data to create a graph. Students utilize their graph to make an inference about the slope of pi.
Curated OER
Gathering Statistics for Research
Young scholars gather statistics to include in their research. In this statistics activity, students investigate how to incorporate statistics into research and other readings besides math. They collect data based on other topics,...
Curated OER
Pendulums on the Moon
Students conduct experiments to determine if length, mass, or starting angle has any effect on the rate of a pendulum's swing. They also conduct an experiment online to determine if gravitational force plays a role in the swing. Groups...
Science 4 Inquiry
Atmospheric Layers
Space diving refers to the act of jumping from outer space and falling through Earth's atmosphere before parachuting to land. Scholars learn about this extreme activity and study the layers of the atmosphere they must conquer in the...
Curated OER
Water Quality
Students examine water quality and how to improve it, how to measure it and how it relates to human activities. In this water quality lesson students sample water from different sources, and test the samples.
Curated OER
Is there Treasure in Trash?
More people, more garbage! Young environmentalists graph population growth against the amount of garbage generated per year and find a linear model that best fits the data. This is an older resource that could benefit from more recent...
Curated OER
Mean and Standard Deviation
Get two activities with one lesson. The first lesson, is appropriate for grades 6-12 and takes about 20 minutes. It introduces the concept of measures of central tendency, primarily the mean, and discusses its uses as well as its...
Curated OER
Application and Modeling of Standard Deviation
The first activity in this resource has learners computing the mean and standard deviation of two different data sets and drawing conclusions based on their results. The second activity has them using a dice-rolling simulation to...
Curated OER
Which Fish Where?
Here is a lesson outline that prompts elementary students to graph and analyze data regarding fish caught along the Hudson River. They will review vocabulary and complete 2 worksheets which can be accessed by clicking on the provided links.
Curated OER
Scattered About
Learners are introduced to the concept of scatter plots after reviewing the various types of graphs. In groups, they analyze the type of information one can receive from a scatter plot and identify the relationship between the x and y...
Curated OER
Estimation & Central Tendency
Eighth graders view pictures that show many objects, estimate amount that they think they saw, and take class data from estimation to find the mean, median, mode, and range for the class.


