Curated OER
Venn Diagram and UK Basketball
Students analyze data and make inferences. In this algebra lesson, students collect and analyze data as they apply it to the real world.
Global Change
Impact of Climate Change on the Desert Pupfish
A fish that lives in the desert? You and your class can meet the desert pupfish as they examine its habitat, the role humans play in diminishing water supplies, and how climate change might impact this fishy friend. There are four short...
Rochester Institute of Technology
Hazmat Disposal
What a waste! The last installment of a nine-part technology/engineering series teaches learners about medical waste disposal systems. Conducting a simulation allows individuals to understand how monetary considerations constrain waste...
Curated OER
The Probability Scale
Students collect data and make predictions. In this probability lesson, students perform experiments calculating the chance of an event occurring. They draw conclusion based on their data.
Physics Classroom
As the Crow Flies Lab
A simple, yet memorable, way of practicing with displacement vectors is described here. Divide your class into groups and assign each a different landmark on campus. They measure smaller legs of the path from the classroom to their...
Curated OER
How Oceans Affect Climate
Learners draw conclusions about how the ocean affects temperature. In this weather lesson, students use the Internet to gather data to help them come to a conclusion about how the climate in a certain region is directly affected by the...
Curated OER
Population Pyramids
Students utilize population pyramids to answer questions, make comparisons, draw conclusions and support predictions about the populations of China, India and the Unites States. They arrange numbers and symbolic information from various...
Curated OER
Population Pyramids
Students work with and make population pyramids. In this population pyramid lesson plan, students use census data to make population pyramids for China, India, and the United States. They use the information to determine why jobs are...
Curated OER
Environment: Wild Wind Direction
Learners examine the different types of wind patterns. Using common materials, they construct weather vanes to measure and record wind direction over a two-week period. After analyzing the data, they draw conclusions about the...
Curated OER
What's in the Water?
Fifth graders use the dots to simulate water pollutants in a lake. They use cups to collect a sample of "water." Students sort the dots by color and record the number of each dot color under the correct pollutant name in the Lake Water...
Curated OER
Statistics with State Names
Students analyze the number of times each letter in the alphabet is used in the names of the states. In this statistics lesson, students create a stem and leaf plot, box and whisker plot and a histogram to analyze their data.
Curated OER
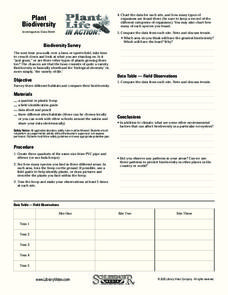
Plant Life in Action
Sixth graders examine various habitats and record the living creatures they found. In this biodiversity lesson, 6th graders complete a worksheet recording their observations. Students draw conclusions about the climate and its effect on...
Curated OER
Climate Change
Students compare weather data and draw conclusions. In this climate change lesson plan, students determine whether data collected over a period of ninety years shows a warming trend.
Curated OER
What Plants Need in Order to Survive and Grow: Light
Students conduct an experiment to evaluate whether plants need light to survive and grow. They observe and gather data about plant responses to different growth regimes, analyze the data, and make conclusions about basic plant needs.
Curated OER
Polluting the Environment
Fourth graders construct mini-ecosystem, pollute the ecosystem, observe, collect, and record data on the effects of these pollutants on their ecosystem, organize data on spreadsheets, create graphs, and design presentations to share with...
Curated OER
Diffusion
Students design and carry out an experiment according to the scientific method. The experiment must test the effects of time and concentration on the rate of diffusion of potassium permanganate into potato cubes. After performing the...
Curated OER
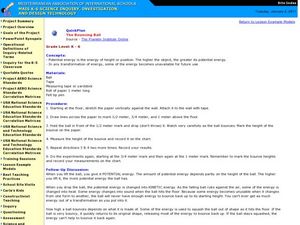
The Bouncing Ball
Students use the scientific method to conduct an experiment to test how a ball bounces. In this inquiry-based physical science and scientific method instructional activity, students drop a ball from specified heights and record the...
Curated OER
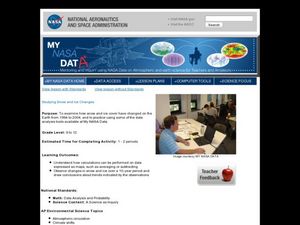
Studying Snow and Ice Changes
Students compare the change in snow and ice over a 10 year period. In this environmental science lesson, students use the live data on the NASA site to study and compare the monthly snow and ice amounts on a map of the entire Earth. ...
Ohio Department of Education
Observe Then Infer
Upper elementary scientists learn that observations made can lead to inferences. They rotate through six weather-related stations that challenge them to make observations and then draw inferences from their observations. A...
Curated OER
Analyzing the Job Market for Babysitting in Your Neighborhood
Middle schoolers conduct research on a neighborhood in Canada. In this data analysis lesson, students use data from the 2006 Canadian census to draw conclusions about a population group.
Curated OER
Is There Liquid Water on Mars?
Students assess whether there is liquid water on Mars by analyzing images and data. In this planetary lesson students analyze temperature and pressure graphs and hypothesize about how water could have flowed on Mars.
Curated OER
Tides & Lunar Cycles
Learners demonstrate how the moon affects the tides, a neap tide, and spring tides by using their bodies as models. After students observe the model they created, they draw and label the diagram on a provided worksheet. They then log...
Curated OER
Urban Effects on Inshore Plankton
Learners investigate the effects of urban pollution on plankton. In this plankton and pollution lesson plan, students use samples of plankton collected in urban areas to observe the effects of pollution on plankton samples. They...
Curated OER
Health Care
Students analyze information and draw conclusions about the reality of human life expectancy; the battle between health care technology and our own internal time clocks. Students answer questions such as "Why does aging occur and can...


