Curated OER
Comparing Costs
Students compare the costs of two cellular phone plans and determine the best rate. They use a table and a graph of points plotted on a Cartesian plane to display their findings. Students write an equation containing variables that could...
Curated OER
Does One Tree a Forest Make?
Students take a walk around the schoolyard looking at and identifying the trees. One leaf for each tree is collected. A chart is developed that represents the population of trees on the school ground. They keep journals and write an essay.
Curated OER
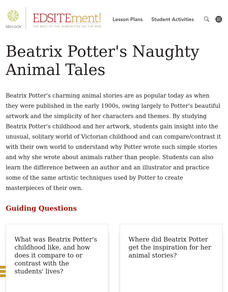
Beatrix Potter's Naughty Animal Tales
Students gain insight into the unusual, solitary world of Beatrix Potter's Victorian childhood and can compare/contrast it with their own world to explain why Potter wrote such simple stories and why she wrote about animals rather than...
Curated OER
Polluting the Environment
Fourth graders construct mini-ecosystem, pollute the ecosystem, observe, collect, and record data on the effects of these pollutants on their ecosystem, organize data on spreadsheets, create graphs, and design presentations to share with...
Curated OER
Data Analysis, Probability, and Discrete Math: Line Graphs
Eighth graders analyze data from line graphs. They discuss the purpose of line graphs, identify the parts of a line graph, answer questions about various graphs, and complete a worksheet. This lesson includes a script to teach along with.
Curated OER
Rock vs. Mineral - Lesson #2
Students visually distinguish between those rocks that appear to be made of one substance, vs. those that appear to have more than one. This leads to the distinctions that indicate the different types of rocks: igneous, sedimentary and...
Curated OER
Music Composition
Students compose a simple melody using the notes of the D Major Scale. Criteria/Rubric for evaluation is provided with variations depending on skill level of students. A minimum of one forty-five minute class period is needed for this...
Curated OER
Pollution Search
First graders identify forms of pollution and describe effects that various pollutants can have on people, wildlife, and plants; students describe relationships between various forms of pollution and human actions.
Curated OER
Monkey See, Monkey Do
Students consider the influence of bullies and map the social ecosystem of their schools. They create lifelines that compare baboon and human development and write an essay that considers the relationship between psychosocial development...
Curated OER
Enzyme Grabbers
Learners perform two experiments to show the properties of enzymes. They use pectinase to produce apple juice from applesauce to show enzyme action and then taste the difference between raw and boiled papaya seeds as evidence of enzyme...
Curated OER
Foreign Cuisine: International Foods
Students describe factors that influence one's food choices, explain how food choices reflect one's culture and ethnic background, identify ways that family members and friends may affect one's food decisions and preferences, and explain...
Curated OER
Carrot Sticks or French Fries?
Students investigate the influence of fast food brand names on food choices and analyze the factors that contribute to branding preferences. They write an opinion essay on the corporate responsibility to influence food choices.
Curated OER
Activity on United States Moon Landing: Apollo 11
Young scholars use the World Wide Web to access additional information needed to complete a set of questions. They demonstrate an understanding of latitude and longitude by interpreting a lunar map.
Curated OER
Antebellum North Carolina
Eighth graders examine pictures & documents relating to the Hayes Plantation (Edenton, NC). They also use various maps of North Carolina to help them analyze how James Cathcart Johnston used, modified and adapted to the physical...
Curated OER
The Buckshot Stops Here
Young scholars study the incident between Vice President Dick Cheney and his friend while hunting. They brainstorm and research different scandals throughout History and complete a homework assignment.
Curated OER
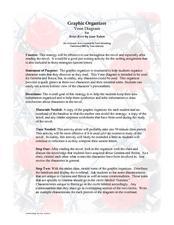
Graphic Organizer: Venn Diagram for Briar Rose
Compare and contrast the characters of Gemma and Becca from Briar Rose. Using a Venn diagram (not included but easy to create), readers will explore the characters. Not much direction or explanation is included here.
John F. Kennedy Presidential Library & Museum
Analyzing the Inaugural Address
Get high school historians to step outside their own shoes by responding to JFK's inaugural address from the perspective of a civil rights activist, a soviet diplomat, or a Cuban exile. After a class discussion about the address,...
Curated OER
Friar Margil and the Spanish Missions
Students examine the concepts of diversity and assimilation. They identify the validity of sources and recognize bias, and create original illustrations from the students' point of view which show the impact of the Spanish friars on the...
Curated OER
Trash Count
Students identify pollution around their local community. They discuss the sources of polution and categorize objects based on their properties. They discover ways to make changes to the environment and how to inform the public.
Curated OER
The Envelope Please
Students research an animal of the rainforest. They create a computerized claymation to present their research.
Museum of Tolerance
Family Role Model Activity
What does is take to be a role model? Through grand conversation, and the use of books and a graphic organizer, scholars find out and apply the requirements to identify a role model within their family. They then journey through the...
Curated OER
Which Animals Should Be Saved?
Fifth graders investigate the concepts related to the endangerment of different animal species. They conduct research using a variety of resources. The skills of prediction are used to show the possible outcome of the extinction of a...
Curated OER
Finding PI
Students select and use appropriate operations, methods and tools to compute or estimate using whole numbers. They develop and use formulas for determining the circumference and area of circles. Students determine and describe the...
Curated OER
The Dog Days of Data
Students practice an alternative form of data presentation. They practice sequencing data, identifying the stem-and-leaf, creating stem-and-leaf plots, and drawing inferences from the data by viewing the plots.


