Cornell University
Constructing and Visualizing Topographic Profiles
Militaries throughout history have used topography information to plan strategies, yet many pupils today don't understand it. Scholars use Legos and a contour gauge to understand how to construct and visualize topographic profiles. This...
Curated OER
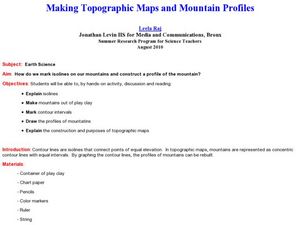
Making Topographic Maps and Mountain Profiles
Students study how to mark inclines and construct a mountain profile. In this topographic map lesson students mark contour intervals and draw mountain profiles.
Curated OER
Contour Map Worksheet #4
There are only four questions here. There is a contour map of Cottonwood, Colorado and the creek that crosses it. Earth scientists tell in what direction the creek flows, identify the highest elevation on the map, draw a topographic...
Curated OER
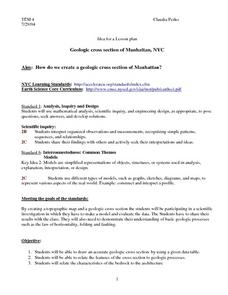
Geologic cross section of Manhattan, NYC
High schoolers draw an accurate geologic cross section by using a given data table. They relate the features of the cross section to geologic processes. Students then relate the characteristics of the bedrock to the architecture.
Curated OER
Candy Bar Subsurface Geology
High schoolers are introduced to drawing and interpreting topographical maps. They each cut through there Jell-o mountain at regular height intervals, and trace around the shape of the Jell-o cut off at the height, overlaying the...
Curated OER
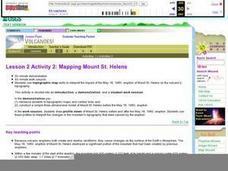
Lesson 2 Activity 2: Mapping Mount St. Helens
Students use topographic map skills to interpret impact of the May 18, 1980 eruption of Mount St. Helens on the volcano's topography, and draw profile views of Mount St. Helens before and after the May 18, 1980, eruption.
Curated OER
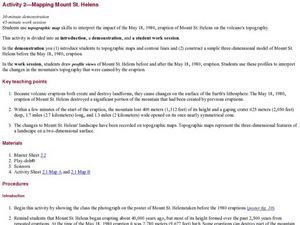
Mapping Mount St. Helens
Students study topographic maps and contour lines and construct a simple three-dimensional model of Mount St. Helens before the May 18, 1980, eruption. They use topographic map skills to interpret the impact of the May 18, 1980, eruption...
Global Change
Impact of Climate Change on the Desert Pupfish
A fish that lives in the desert? You and your class can meet the desert pupfish as they examine its habitat, the role humans play in diminishing water supplies, and how climate change might impact this fishy friend. There are four short...
Curated OER
MAPPING THE TOPOGRAPHY OF UNKNOWN SURFACES
Students describe in words and graphic displays the elevation or depression profile of sections of Mars' Olympus Mons and/or Valles Marineris. They explain how orbiting spacecraft build up global maps one data slice at a time.
Curated OER
TOPSY TURVY MAPS
Eighth graders use the data analyzer and motion detector to collect data and measure distances. They create topographic maps drawn to scale of a given setup and relate the concepts to the creation of historical ocean maps.
Curated OER
Mapping the Sea Floor
Students review their prior knowledge on topographical maps. Using a map, they examine the sea floor off the coast of San Diego, California. With a partner, they chart the sea floor of an area and use cutouts to create a visual...
Curated OER
Snow Cover By Latitude
Students create graphs comparing the amount of snow cover along selected latitudes using data sets from a NASA website. They create a spreadsheet and a bar graph on the computer, and analyze the data.
Curated OER
Using My Nasa Data To Determine Volcanic Activity
Students use NASA satellite data of optical depth as a tool to determine volcanic activity on Reunion Island during 2000-2001. They access the data and utilize Excel to create a graph that has optical depth as a function of time for the...


