University of Colorado
Great Red Spot Pinwheel
The great red spot on Jupiter is 12,400 miles long and 7,500 miles wide. In this sixth part of a 22-part series, individuals model the rotation of the Great Red Spot on Jupiter. To round out the activity, they discuss their findings as a...
Colorado State University
If Hot Air Rises, Why Is it Cold in the Mountains?
Investigate the relationship between temperature and pressure. Learners change the pressure of a sample of air and monitor its temperature. They learn that as air decreases its pressure, its thermal energy converts to kinetic energy.
NOAA
Communicate!: Create a Unique Message About Climate Change
Scholars use their communication skills to express their take on climate change in the ninth installment of the 10-part Discover Your Changing World series. They create ways to deliver their messages on a specific aspect of climate by...
NOAA
Climate, Weather…What’s the Difference?: Make an Electronic Temperature Sensor
What's the best way to record temperature over a long period of time? Scholars learn about collection of weather and temperature data by building thermistors in the fourth installment of the 10-part Discover Your Changing World series....
US Geological Survey
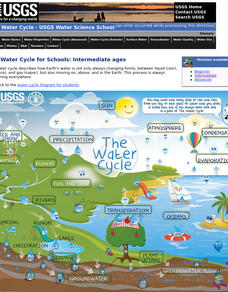
The Water Cycle for Schools: Intermediate Ages
Water can travel from the highest mountain tops to the largest oceans. Using an interactive, young scientists trace the movement using an interactive online resource. They follow the water cycle by reading pop-up explanations on a...
PHET
Planet Designer: Kelvin Climb
It's time to get those creative juices flowing! This second lesson in a series of five continues allowing pupils to design their own planets. It the same format as the first, but, this time, allows students to alter greenhouse gases...
NOAA
Are You Climate Literate?: Play the Essential Principles Challenge
Installment eight of the 10-part Discover Your Changing World series tests the class's understanding of climate. Scholars play alone or in small groups to assess their understanding of climate systems, causes of climate...
Colorado State University
Why Does the Wind Blow?
Without wind, the weather man wouldn't have much to talk about! Blow away your junior meteorologists with a creative demonstration of how wind works. The activity uses an empty soda bottle and compressible Styrofoam peanuts to illustrate...
American Museum of Natural History
Rising CO2! What Can We Do?
It is colorless and scentless, but it makes a large impact on the environment. Learners explore carbon dioxide emissions and what they mean for the environment using an interactive graph. They review changes over time and how they impact...
Colorado State University
What Is a "Convection Cell"?
Round and round in circles it goes! A hands-on activity has learners recreate a model of a convection cell. They watch as the difference in density of their materials creates a current.
Teach Engineering
Building a Barometer
Forget your local meteorologist — build your own barometer and keep track of the weather with an activity that provides directions to build a barometer out of a narrow necked bottle, a glass, and some water. Using their barometer,...
NOAA
Make Your Own Compass
Scholars build a compass using a needle, cork, magnet, and a water-filled cup in order to locate the magnetic north and south.
Curated OER
Micro-Climate
Atmosphere aces investigate the microclimates that exist within a larger area. They use a thermometer to record the varying temperatures and identify the microclimates on a map that they have drawn. This exercise helps them to understand...
Curated OER
The Day After Tomorrow: How is the Density of Water Related to Climate Change and Global Warming?
Science learners simulate what happens when ice breaks up and floats on water and how increased pressure on ice causes it to melt faster. They view a clip from the movie, The Day After Tomorrow, and relate their lab activities to what...
US Environmental Protection Agency
Sea Level: On the Rise
With the global temperature on the rise, the effects of climate change are starting to be seen. However, many people have a difficult time conceptualizing the long-term effects, such as sea levels rising. Given an easy and effective...
National Wildlife Federation
Quantifying Land Changes Over Time in Areas of Deforestation and Urbanization
Is qualitative or quantitative research more convincing when it comes to climate change? In the eighth instructional activity during this 21-part series, scholars begin by performing a quantitative analysis of deforestation and...
Curated OER
Geographic Effects on Precipitation, Water Vapor and Temperature
Students investigate the factors affecting climate using Live Access Server. In this geography lesson plan, students graph atmospheric data using Excel spreadsheet. They compare and contrast temperature, precipitation and water vapor of...
Curated OER
Global Warming – More or Less
Eighth graders identify the factors that contribute to global warming. In this earth science lesson, 8th graders evaluate the impact of global warming on the planet. They discuss their views within the group.
Curated OER
What's Making It Look So Brown Outside?
Ninth graders analyze cars and particulate matter in the atmosphere. They analyze results of particulate pollutants and identify which vehicle gives off more particulates. They identify sources of particulate matter and relate to...
Curated OER
Weather Instrument Use and Application
Eighth graders measure temperature, wind speed and pressure using Skymaster SM-28. In this earth science instructional activity, 8th graders collect data and record observations taken from outdoors. They explain why numerical values are...
Curated OER
Weather Forecasting Basics
Eighth graders analyze weather diagrams and weather maps. In this earth science instructional activity, 8th graders explain why it is important to know the weather. They complete a handout at the end of the instructional activity.
Curated OER
Geology and it’s Influence
Students compare current geological map and the one from 1800's. For this earth science lesson, students discuss differences between the two and explain the factors that caused the change. They write an essay about how these changes...
Curated OER
Weather Elements and Instruments
Eighth graders identify the different weather elements. In this earth science lesson plan, 8th graders explain the difference between relative humidity and dew point. They discuss the different instruments used to predict weather.
Curated OER
Volcanoes: Mount Vesuvius
Young scholars explain how volcanoes form. In this earth science lesson, students identify the different types of volcanoes. They create brochures about Mt. Vesuvius before and after the eruption.


