Curated OER
Sea Surface Temperature Trends of the Gulf Stream
Students explore the importance of the Gulf Stream. Using a NASA satellite images, they examine the sea surface temperature. Students collect the temperature at various locations and times. Using spreadsheet technology, they graph the...
Curated OER
Sea Surface Temperature Trends of the Gulf Stream
Students use authentic satellite data to produce plots and graphs of sea surface temperature as they explore the seasonal changes of the Gulf Stream.
Curated OER
Using My Nasa Data To Determine Volcanic Activity
Students use NASA satellite data of optical depth as a tool to determine volcanic activity on Reunion Island during 2000-2001. They access the data and utilize Excel to create a graph that has optical depth as a function of time for the...
Curated OER
Geography: Analyzing the Local Environment
Students, in groups, explore the school grounds and organize their findings according to the five themes of geography. They take notes and sketch the grounds. Students divide the school and grounds into regions based on use.
Curated OER
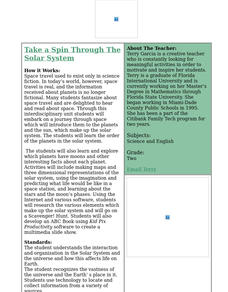
Take a Spin Through the Solar System
Second graders participate in a variety of activities to explore the Solar System in this unit.
Curated OER
Cool, Clear Water - Or Is It?
Students use a problem solving method to offer a solution to one of the water quality problems within the Kansas Lower Republican River Basin. Groups research a problem area, then produce a skit, poem, song or story to illustrate the...
Curated OER
Creating and Analyzing Graphs of Tropospheric Ozone
Students create and analyze graphs using archived atmospheric data to compare the ozone levels of selected regions around the world.
Curated OER
Let's Get To the Core!
Students practice analyzing ice core samples to discover climate changes. Using the samples, they identify and graph the gas amounts. They use these numbers to determine their effect on global warming. In pairs, they complete a...
Curated OER
Physical Habitat of a Stream
Young scholars measure in metric units and use a stopwatch, calculator. They collect data with minimal instructions after the initial pre-activity briefing, then record data in the data sheets provided.
Curated OER
Nobody's Home
Students participate in a simulation activity that examines the economic impact of the construction of a reservoir-both the positive and negative side.
Curated OER
Drop in the Bucket
Students study the sources for the water they use. They determine their town's major water supply and how many gallons per day does the population use.
Curated OER
Do Human Practices Affect Water Quality?
Students determine if human practices have any noticeable effects on the quality of stream life as measured by the presence of certain macroinvertebrates. They collect, preserve and identify macroinvertibrate samples and quantify the data.
Curated OER
"Tsunamis"
Students visit a PBS Website about tsunamis to consider their causes, effects and steps countries have taken to try to defend against them. They answer questions and create a brochure explaining tsunami facts and procedures to survive a...
Curated OER
Would You Drink This?
Students examine how they affect water quality of those who live downstream after identifying rivers and river basins in Kansas.
Curated OER
It's Not My Problem!
Students examine how rivers flow through the country to sea level. Students study how upstream pollution effects the water and people downstream.
Curated OER
Aruba Cloud Cover Measured by Satellite
Students analyze cloud cover over Aruba. They compose and submit written conclusions which include data, analysis, errors in data collection, and references.
Curated OER
My Own Private Idaho; Using Social Studies to Explore Idaho
Students engage in several activities to explore Idaho and Social Studies themes. Using an variety of media, students become familiar with Idaho's geography and geology.
Curated OER
Integrated Lesson Plan
An ambitious and engaging lesson on the Westward Movement for your students to enjoy! Groups of learners rotate between learning tasks such as learning about the Chislom Trail, Lewis and Clark, and the Gold Rush. A WebQuest is also...
Curated OER
Atlas Scavenger Hunt
Students discover what type of information in an atlas by participating in a scavenger hunt. With a partner, they try to find the answers to many questions as possible. They exchange their papers with another partner group and check...
Curated OER
What's Its Slope
Young scholars identify the slope of a lines.In this algebra lesson, students define the meaning of slope and write an equation given the slope. They graph linear functions using the slope and y-intercept.
Curated OER
Salt: White Gold
Students examine the importance of salt for trade routes and the economy of a community.
Curated OER
High Mountain Retreat
Students explore and analyze atmospheric conditions for a high mountain retreat. They examine the relationship between altitude, atmospheric pressure, temperature and humidity at a particular location. In addition, they write reports...
Curated OER
Building a Scale Model
Third graders create a model of the solar system. In this solar system lesson, 3rd graders create a scale model of the solar system. Working in pairs students solve mathematical problems to correctly measure the distance each planet is...
Curated OER
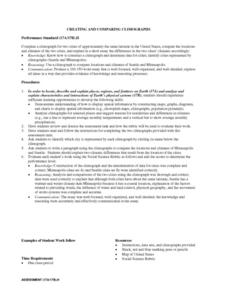
Creating and Comparing Climographs
Students are introduced to the importance and usefulness of climographs. In groups, they create a climograph of two cities on about the same latitude. They compare and contrast the locations and climates of the two cities and write a...


