Curated OER
Similarity and Dilations - Discover Properties of Similar Figures
Learners investigate properties of similar figures. In this properties of similar figures instructional activity, pupils construct similar figures using Cabri Jr. They dilate their figure to create a similar one, and discuss the...
Curated OER
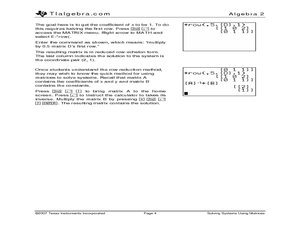
Solving Systems Using Matrices
Explore the concept of systems of equations in two variables and use matrices to solve them. Young mathematicians enter coefficients and constants into a matrix and then solve using row reduction. Instructions on how to use the shortcut...
Curated OER
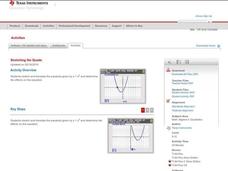
Stretching the Quads
Explore parabolas in this algebra lesson with the graphing calculator. The class investigates what effects the changing of the parameters of the vertex form of a quadrati have to its graph. They find the zeros of a quadratic graphically...
Curated OER
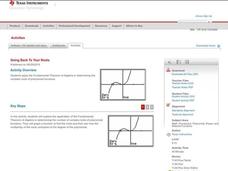
Going Back to Your Roots
Who doesn't need to know the Fundamental Theorem of Algebra? Use the theorem to find the roots of a polynomial on a TI calculator. The class explores polynomials with one solution, no real solutions, and two solutions. This less lesson...
Curated OER
Exploring Expressions
Examine parts of an expression in this algebra instructional activity. Ninth graders identify the properties of the coefficient and their behavior to the graph. They graph the equation on a TI to see their results.
Curated OER
Exploring Quadratic Data with Transformation Graphing
Using a data collection device to collect data regarding a bouncing ball, high schoolers use various features on graphing calculators to experiment with the parameters of the vertex form of the parabola and their effect on the shape of...
Virginia Department of Education
Organizing Topic: Data Analysis
Learners engage in six activities to lead them through the process of conducting a thorough analysis of data. Pupils work with calculating standard deviations and z-scores, finding the area under a normal curve, and sampling techniques....
Curated OER
Function Graphing--ID: 8252
Those graphing calculators can be tricky; good thing Texas Instruments has devised a lesson on how to use their TI-Nspire calculator to graph functions. Kids investigate functional notation as they graph ordered pairs in the form (a,...
Texas Instruments
Finding Linear Models Part III
Explore linear functions! In this Algebra I lesson, mathematicians graph data in a scatter plot and use a graphing calculator to find a linear regression and/or a median-median line. They use the model to make predictions.
Teach Engineering
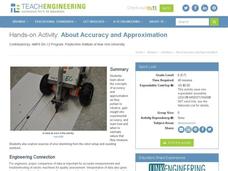
About Accuracy and Approximation
How accurate are robots? Groups draw lines by moving robots backwards and forwards by one rotation of the wheels. Using the appropriate formula, they determine the percent error in the length of the lines in relation to the calculated...
NTTI
Transform Your Geometry into a Work of Art
Mathematicians utilize artwork to help illustrate the major ideas of transformations and tessellations. They visually identify transformations including reflections, rotations, and translations. They discuss how artists have used...
Curated OER
Visualizing Vectors
Investigate vectors in standard positions and use the CellSheet application on the TI calculator to find the sum of two vectors. Convert from polar to rectangular coordinates and vice versa, and show graphs of the vectors.
Virginia Department of Education
Special Right Triangles and Right Triangle Trigonometry
Right triangles are so special! Use special right triangles to discover the trigonometric ratios. Pairs construct special right triangles and find the values of the ratios of the sides. In the process, they discover the ratios stay the...
Virginia Department of Education
Circles in the Coordinate Plane
Make the connection between the distance formula and the equation of a circle. The teacher presents a lesson on how to use the distance formula to derive the equation of the circle. Pupils transform circles on the coordinate plane and...
Curated OER
Measurement Web
Student discuss their prior knowledge of the concept of measurement with class. Then, making a graphic organizer students use educational software to create a web which is then printed off for each student.
Curated OER
100 Stamps for 100 Days
Students recognize similarities and generalize patterns. In this math and technology lesson plan, students develop an understanding of number patterning by grouping stamps and counting by 10s.
Curated OER
Let's Share Equal Parts
Students practice creating parts of a whole by using educational software to illustrate their learning.
Curated OER
Poison Boxes
Students utilize the Poison Boxes activity on The Nature Park is used to practice the recognition of 2D shapes and their properties. They utilize a mathematics educational software program to gain practice.
Curated OER
Lagoon Lake
Learners develop skill in using co-ordinates. Up to eight cardinal points of the compass are used making this a useful activity in simple map and grid work. They utilize educational software to gain practice.
Curated OER
Squirrel Challenge
Students utilize The Nature Park Adventure educational software program to Introduce Modelling, Including the Estimation of Angles.
Curated OER
Tunnel Traps
Students identify shapes that match specific shape descriptions involving a range of geometric terms and correct polygon names. They utilize a mathematics educational software program to gain practice.
Curated OER
Graphing Equations
Students use an interactive website or cd rom to graph equations. The lesson plan is not very clearly written. The use of the website is essential or the educational software that can be purchased from the Prentice Hall publisher.
Curated OER
City, County, Community
Students explore issues and situations that make for a city and its local environments. In this local government lesson, students design maps, define issues and create brochures that illustrate their understandings of these concepts and...
Curated OER
Are You My Little Peanut?
Fourth graders explore the mass and length of peanuts by pretending to parent a peanut. In this mode, median and range activity students graph their measurements and then use them to find the mode, median and range. Students discuss...


