Community Partnerships for Adult Learning
Goals Setting
You can reach your goals, if you're SMART about it! Teach your class to how build specific goals that include all the elements of the acronym SMART. The plan includes detailed procedures for the teacher and requires pupils to...
National Security Agency
Going Green with Graphs
In this unit designed for second graders, youngsters are introduced to conducting surveys and creating tally charts based on the data they gather. Students then construct bar graphs, and observe the relationships between the two...
Virginia Department of Education
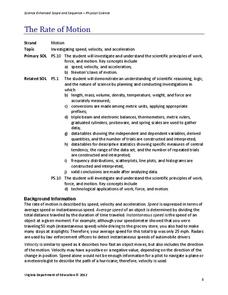
The Rate of Motion
How much time does it take to jump over three balloons? Pupils calculate the speed of tasks that require different motions. They determine motions for tasks such as walking, skipping, hopping, and jumping before creating a...
Achieve
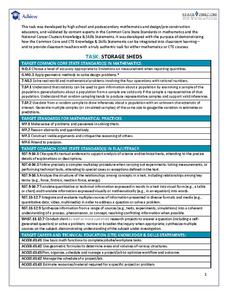
Task: Storage Sheds
Bridge the gap between mathematics and Career Technical Education. Pupils research the cost associated with building storage sheds and analyze possible profit. They build scale models and determine if building and selling the sheds is a...
Intel
Fair Games
Who said things were fair? The unit introduces probability and its connection to fairness. The class interacts with activities of chance and plays games to relate them to fairness. Groups design a fair game and develop a presentation....
Virginia Department of Education
Road Trip
Help plan a road trip with linear equations. Scholars consider two different rental car companies and write equations representing the cost for each company. They graph the system of equations to determine the conditions under which each...
Virginia Department of Education
Curve of Best Fit
Which function models the data best? Pupils work through several activities to model data with a variety of functions. Individuals begin by reviewing the shapes of the functions and finding functions that will fit plotted data points. By...
Virginia Department of Education
Box-and-Whisker Plots
The teacher demonstrates how to use a graphing calculator to create box-and-whisker plots and identify critical points. Small groups then create their own plots and analyze them and finish by comparing different sets of data using box...
Virginia Department of Education
Line of Best Fit
Pupils work through a guided activity on fitting a linear equation to a set of data by entering the data into a calculator and trying to envision a line of best fit. They then have the calculator determine the least-squares line and...
Virginia Department of Education
z-Scores
Just how far away from the mean is the data point? Pupils calculate the standard deviation for a set of data and find out how many standard deviations a point is away from the mean. The teacher leads a discussion on how to calculate...
Mathematics Vision Project
Modeling Data
Is there a better way to display data to analyze it? Pupils represent data in a variety of ways using number lines, coordinate graphs, and tables. They determine that certain displays work with different types of data and use...
Virginia Department of Education
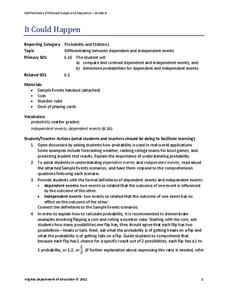
It Could Happen
Understanding of probability will probably increase with the use of a refined resource. Pupils learn to distinguish between dependent and independent events as they calculate the probabilities of these types of events in various...
Education Development Center
Choosing Samples
What makes a good sample? Your classes collaborate to answer this question through a task involving areas of rectangles. Given a set of 100 rectangles, they sample a set of five rectangles to estimate the average area of the figures. The...
Healthy Native Youth
Chapter 6: Making Choices
A lesson looks closely at risky behavior such as teen pregnancy and sexually transmitted diseases. Middle schoolers use a question box to ask questions anonymously. They role-play what life would be like if they became pregnant then...
Center for History Education
To What Extent Were Women's Contributions to World War II Industries Valued?
Women rose to the challenge when the nation's war effort called them—but were sent home when the GIs came back from World War II. Young historians consider whether the United States valued women's contributions during the war using a...
Curated OER
Theoretically Speaking
Students define probability. They determine outcome from a given situation based on simple probability. Students create experimental data using a coin and a number cube. They write how theoretical and experimental probability are different.
Curated OER
People, Not Numbers: Bringing 12 Million into Personal Ter
Students forge a compassionate link to the large numbers of people who were the victims of slavery as opposed to thinking of them simply in terms of numbers. They perform a math exercise to put the number of people in slavery into...
Curated OER
Essential Services
Students discuss necessary community services then complete a worksheet by filling in essential services, the needed inputs and outputs produced by fulfilling the service.
Curated OER
Making a Mini-Landfill
Pupils create a mini-version of a landfill. They examine the materials they use everyday and determine if they decompose or not. They identify the materials as renewable or nonrenewable as well.
Curated OER
Democracy through Parliamentary Committees / Lessons 2 : Selecting and Studying a Specific Bill
High schoolers appreciate and respect the advantages of Canada's parliamentary system. They engage in a instructional activity which illustrates the important role committees play in drafting bills.
Curated OER
Survey Strategy
Young scholars develop their research techniques and their ability to question and think critically about democracy and the parliamentary system of government.
Curated OER
Growing a Garden
Students research aspects of gardening including nutrition, costs, and soil preparation. They then write a report detailing the planning of the garden and compare costs to buying the items.
Curated OER
Voter Turnout
Students solve problems using math. They complete a graph, using data from the 2000 presidential election results. Students predict and calculate the outcome of the election based upon the voting patterns.


