Curated OER
Practice Estimating!
Bring math home with this interative estimating worksheet! Scholars make educated guesses about the number of six household items: crayons in a crayon box, keys on a key ring, coins in a piggy bank, trees in the yard, pictures on the...
American Statistical Association
Confidence in Salaries in Petroleum Engineering
Just how confident can we be with statistics calculated from a sample? Learners take this into account as they look at data from a sample of petroleum engineer salaries. They analyze the effect sample size has on a margin of error and...
American Statistical Association
An A-MAZE-ING Comparison
Teach your class how to use descriptive statistics through a hands-on data collection activity. Pupils collect their own data, calculate test statistics, and interpret the results in context. They compare male and female results, looking...
Statistics Education Web
NFL Quarterback Salaries
Use statistics to decide if NFL quarterbacks earn their salaries! Learners study correlation coefficients after using technology to calculate regression equations. Through the data, they learn the meaning of correlation and correlation...
American Statistical Association
Colors Challenge!
Does writing the name of a color in a different colored ink affect one's ability to read it? Scholars design an experiment to answer this question. They collect the data, analyze the statistics, and draw a conclusion based on what they...
Curated OER
Winter Olympics History Year by Year
Investigate the history of the Winter Olympic Games. After researching this event and compiling necessary statistics, pupils use a graphic organizer to chart their findings. A template for a chart is included in this resource. Have your...
American Statistical Association
Bear Hugs
Scholars research arm span to determine who gives the best bear hugs. They use data from a national study to find the standard statistics for arm span. It includes mean, median, quartiles, spread, standard deviation, and more.
Statistics Education Web
What Percent of the Continental US is Within One Mile of a Road?
There are places in the US where a road cannot be found for miles! The lesson asks learners to use random longitude and latitude coordinates within the US to collect data. They then determine the sample proportion and confidence interval...
Education World
Putting Turkey on a Table (or a Graph)
Grateful learners put turkey on a table (or a graph)! Through a creative project they show statistical information about turkey population, production, and consumption. A great Thanksgiving lesson plan that can be applied at any time to...
Curated OER
If the World Were a Village...
Your class members explore concept that the world is a large place, examine how statistics can be used to help in understanding the world and its people, and create illustrations or graphs of statistics found in the award-winning...
Virginia Department of Education
Mathematics Vocabulary Cards - Grade 2
Augment your math curriculum with posters detailing several concepts important to second grade math. Each poster features one math term from geometry, measurement, probability and statistics, computation and estimation, numbers and...
Los Angeles County Office of Education
Assessment For The California Mathematics Standards Grade 6
Test your scholars' knowledge of a multitude of concepts with an assessment aligned to the California math standards. Using the exam, class members show what they know about the four operations, positive and negative numbers, statistics...
Space Awareness
The Climate in Numbers and Graphs
Weather versus climate: weather relates to short time periods while climate averages the weather of a period of many years. Scholars learn about average temperature and precipitation in various climate zones and then apply statistics...
Virginia Department of Education
Mathematics Vocabulary Cards - Grade 5
Elevate your fifth graders' understanding of math concepts with a series of vocabulary posters. Featuring terms concerning probability and statistics, measurement, algebra, and decimal place value (and many more), the posters are sure to...
Virginia Department of Education
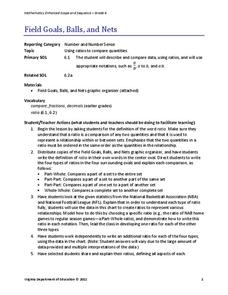
Field Goals, Balls, and Nets
Score a resource on ratios. Young mathematicians learn about different ways to express ratios. Using sports data, they write statements about the statistics in ratio form.
PBS
Technology: Conveniences and Consequences
It's a delicate balance—using technology to improve our lives while still protecting the environment, and ourselves, from the hazards of technology use. Class members examine statistics about the increase in media use, complete a survey...
Curated OER
Get Acquainted with the Great Outdoors
National Parks and Recreation Month offers opportunities to improve health and education.
Federal Reserve Bank
Deflation: Who Let the Air Out?
Why do decreasing prices (deflation) restrain economic growth, and why is this a real concern? Here you'll find reading materials and a related worksheet that gets right to the heart of this question, using recent events and real...
Curated OER
Hunger in the World
Consider various aspects of world hunger in this writing lesson. After taking a pre-test, middle and high schoolers play a map game, analyze and discuss world statistics, and write a report on an assigned country. The lesson can apply to...
Curated OER
Energy Conservation
Students investigate energy conservation. For this energy conservation and analyzing data lesson, students identify and explain several energy sources and research renewable and nonrenewable energy sources. Students use statistics form...
California Department of Education
What’s A Hot Job?
What jobs are the next best thing? Curious career scholars explore their options in activity three of a five-part series. Pupils research job trends and labor statistics before discussing the factors that influence occupation trends.
Echoes & Reflections
Contemporary Antisemitism
Despite the recognized atrocities of the Holocaust, anti-semitism continues. The 11th and final installment of the Teaching the Holocaust series explores the long-term effects of the Holocaust on modern anti-semitism, asking pupils to...
Shodor Education Foundation
Racing Game with One Die
Pupils roll a die to figure out which car advances on a race track. They determine the rules for each car moving forward and, given the statistics of the winner, compare if it matches their predictions.
Curated OER
What is Deforestation?
An overview of deforestation is the focus of this resource, which present the reader with a list of facts. Ten comprehension questions follow; learners can write their answers on a separate piece of paper. Have your environmental...


