PwC Financial Literacy
Finanacial Responsibility and Decision Making: Personal Information and Identity Theft
Elementary schoolers look into the very real, and scary, practice of identity theft. They discover the main techniques used by people who steal other people's identity. Learners produce an identity theft tip sheet and share their tips...
PwC Financial Literacy
Income and Careers: Career Exploration
Elementary schoolers take part in a virtual career day and are exposed to various career opportunities in the finance, education, and medical fields. By accessing a video you can download from the PwC Financial website, learners "shadow"...
US Department of Commerce
Looking at Numbers of Births Using a Line Graph
Was there a baby boom? Using census data, class members take a look at the number of 8-11 year olds and determine their birth years. Scholars create a double line graph to compare the number of births for two states for several years....
Curated OER
Defining Division
Upper graders explore division through fair-shares. They will review fair shares and fractions as a segway into division. They start by playing "Share Fairly" game and create mathematical arguments for solving problems. Manipulatives and...
Curated OER
How Do You Like Your Eggs?
First graders conduct a poll about how people like their eggs. In this graphing lesson plan, 1st graders collect data about how they like their eggs. Students use a picture of themselves to place under the type of egg they like. Students...
Curated OER
One Square Meter
Learners examine various ecosystems using scientific inquiry. Using the local area, they assess the characteristics and conditions in one square meter. They report their findings in the form of a survey map and data sheet. They...
Curated OER
Learning about gravity
Learn how to measure weight with newtons in a science experiment about gravity. After they read a short paragraph about force, fifth graders draw an arrow to indicate which way a spring is being pulled. Next, they survey their family...
Curated OER
Harry Potter Research Project
Young scholars work together to complete a research project on Harry Potter. They write a research question and develop a survey to give to their classmates. Using the results, they create a graph and draw conclusions about the data...
Curated OER
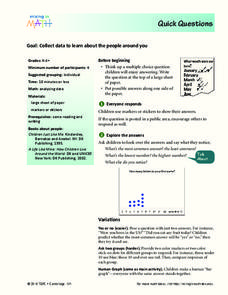
Quick Questions
Students ask their classmates survey questions. In this survey lesson, students come up with a question and possible answers. Their classmates mark their answers and the class discusses what they notice.
Curated OER
Our Favorites
Students participate in and conduct a survey to determine various class favorites. They collect, organize and display their data, interpret the results, and complete a packet of worksheets to display the information.
Curated OER
Graphing Favorite Holidays
Students create spreadsheets and bar graphs based on results of survey of favorite holidays.
Curated OER
The Circle's Measure
Students explore circumference and diameter. For this math lesson, students apply their knowledge of circumference and diameter to solve mathematical riddles. Students apply this knowledge to find circumference and diameter of various...
Curated OER
Too Heavy For Me
Students explore the different arrangement of air molecules in high and low air pressure masses. They compare the temperature of high and low pressure masses and discover how a barometer works.
Curated OER
Graphing Using Excel
Fifth graders complete a series of graphs by gathering information and using Excel to graph the information. In this graphing lesson plan, 5th graders graph favorite desserts of the class. Student put their results into the computer and...
Curated OER
Charts and Graphs
Fifth graders interpret data into graphs and percentages. In this organizing data lesson, 5th graders discuss bar, circle and line graphs. Students complete bar graph and apply probability using the results.
Curated OER
How Different Are We from Other Students?
Fifth graders make bar graphs from data that they have collected. They have been writing to pen pals in Spain for a couple of months and received a survey back from them. They put all the data together that they collected.
Curated OER
Skittles, Taste the Rainbow
Fifth graders learn and then demonstrate their knowledge of a bar and a circle graph using the classroom data. Students are given a pack of skittles candy. Students create a bar and circle graph indicating the results of the contents of...
Curated OER
Probability Lesson Plan
Your learners will examine probability through experiments and dice games. Using a computer, your class will perform simple experiments to collect and analyze data to determine the probability of different experimental results. Young...
Curated OER
Misleading Graphs
Students explore number relationships by participating in a data collection activity. In this statistics instructional activity, students participate in a role-play activitiy in which they own a scrap material storefront that must...
Curated OER
Playing With Probability
Students rotate through work stations where they compute problems of theoretical and experimental probability. In this probability lesson plan, students use simulations of a lottery system.
Curated OER
We Care About Fire Safety
Students investigate the hazards of fires and how to best protect themselves and their family. In this home safety lesson, students examine the importance of a smoke detector and discover how many homes are missing them among their...
Curated OER
Recording Frequency
First graders analyze nursery rhymes and gather data about word frequency. In this frequency lesson, 1st graders create graphs and tables. Students interpret the data.
Curated OER
Wiggle Worms
First graders investigate worms, collect and analyze data. In this worm and data lesson, 1st graders listen to Chick and Duckling from the Macmillan/McGraw-Hill reading series. They conduct experiments with worms, collect simple data,...
Curated OER
Reaction Time
Learners record reaction time data and calculate minimum, maximum, mean, median, and mode. They participate in a class reaction time activity, observe and conduct an online experiment, and discuss and analyze the activity results.


