Curated OER
Bar Graphs
Third graders investigate bar graphs. In this third grade mathematics lesson, 3rd graders collect and analyze data and use the internet’s Graph challenge to create their own graphs. Students write questions for the other students to...
Curated OER
Cookie Topography
Students construct a cross section diagram showing elevation changes on a "cookie island." Using a chocolate chip cookie for an island, they locate the highest point in centimeters on the cookie and create a scale in feet. After tracing...
Curated OER
Data Analysis, Probability, and Discrete Mathematics
Fourth graders analyze the data in a bar graph, pictograph, line graph, and a chart/table and draw conclusions based on the data. They discuss each type of graph, write questions for each graph, and analyze the data as a class.
Curated OER
Preparation and Transition to Two-Column Proofs
Students investigate proofs used to solve geometric problems. In this geometry lesson, students read about the history behind early geometry and learn how to write proofs correctly using two columns. The define terminology valuable to...
Curated OER
Gathering, Recording, and Presenting Data
Sixth graders use the local newspaper to find and discuss examples of uses of statistics and the ways in which the information is presented. They create and represent their own set of data showing how students get to school each day.
Curated OER
Tasty Tech Activity With Excel
Learners are introduce to basic Excel skills, rank their opinions of menu items from fast food restaurants, add their answers to the spreadsheet, and then create a simple graph of the results.
Curated OER
Graphing Our Favorite Candy Bars
Students use ClarisWorks to graph class' favorite candy bars on a bar graph.
Curated OER
Where Have All the Endangered Gone?
Students explore animals that are endangered. They choose an endangered animal that they would like to keep from becoming extinct. Students create a persuasive presentation to persuade someone to understand why they feel keeping their...
Curated OER
M & Ms in a Bag
Students make predictions about the number and colors of M&M's in a snack size package. They create an Excel spreadsheet to record the data from their small group's bag, create a graph of the data, and discuss the variations of data...
Curated OER
Class of 2000 - Student Loans
Students determine how they will finance their postsecondary education. In this student loan lesson, students create spreadsheets that help them budget their first year of college. Students identify methods to fund the budgets and...
Curated OER
Problem Solving with Addition and Subtraction: Post Test
In this addition and subtraction worksheet, students answer multiple choice questions where they solve word problems using 2 and 3 digit numbers. Students complete 10 questions total.
Curated OER
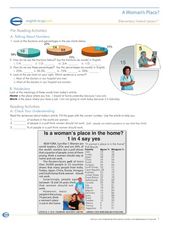
A Woman's Place?
In this women workers lesson, students read an article about women in the workforce and answer 10 questions related to the article. They also convert fractions to percentages.
Curated OER
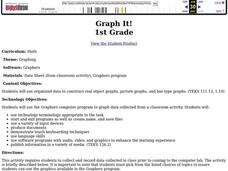
Graph It!
First graders use organized data to construct real object graphs, picture graphs, and bar-type graphs.
Curated OER
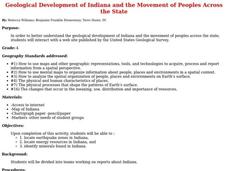
Geological Development of Indiana and the Movement of Peoples Across the State
Fourth graders examine the geological development of the state of Indiana. Using the internet, they interact with the United States Geological Survey. They identify earthquake zones and energy resources in the state. They work...
Curated OER
Geological Development of Indiana and the Movement of Peoples Across the State
Learners are introduced to the geological development of the state of Indiana. Using the internet, they visit the U.S. Geological Survey and locate the earthquake zones in the state. In groups, they locate and identify the energy...
Curated OER
Graphing Fun
First graders analyze objects and make a graphing picture to analyze the data. In this graphing lesson, 1st graders complete an object graph assessment, a picture graph assessment, and a bar graph assessment to analyze their given objects.
Curated OER
Mother May I?
Third graders measure distance using nonstandard units of measure. In this measurement lesson, 3rd graders measure a given distance through the use of the game "Mother May I?" Student gather and compare data on how many "giant steps" and...
Curated OER
Graphing Pockets
Second graders explore graphing. They count the number of pockets on their clothes and use Microsoft Excel to enter their data. Students create a class graph displaying their findings.
Curated OER
The Gathering and Analysis of Data
Young mathematicians gather data on a topic, graph it in various forms, interpret the information, and write a summary of the data. They present their data and graphs to the class.
Curated OER
Reading in the Science Content Area
Help your students internalize scientific ideas by teaching strategies for reading in the content area.
Curated OER
Water, Water, Everywhere!
Get kids excited about environmental studies with these exciting lesson plans about water!
Curated OER
To Market to Market
Fourth graders research a product and participate in an integrated simulation of a free market economy where students will create, buy and sell a good or service. In completing this activity, 4th graders understand the concepts and...
Curated OER
And the Winner Is...
Third graders participate in an election project. They collect data to create a spreadsheet from which a graph is generated.
Curated OER
A Bird's Eye View of our 50 States
Third graders focus on state birds as they learned absolute location (latitude/longitude) of each state, as well as their relative location (bordering states).


