Curated OER
Collecting Data to Learn About the People Around You
Human graphs, anyone? Did you eat fruit today? What is your favorite costume? Have your K – 6 learners graph the responses. Early elementary grades may count and compare while upper grades compare responses of different groups or make...
Curated OER
Technobiz
Students examine candy preferences to create a plan in order to improve candy sales. In this technobiz instructional activity, students build spreadsheet and organizational skills by graphing and calculating data. Students are introduced...
Curated OER
How Different Are We from Other Students?
Fifth graders make bar graphs from data that they have collected. They have been writing to pen pals in Spain for a couple of months and received a survey back from them. They put all the data together that they collected.
Curated OER
We Care About Fire Safety
Students investigate the hazards of fires and how to best protect themselves and their family. For this home safety lesson, students examine the importance of a smoke detector and discover how many homes are missing them among...
Curated OER
Cookie Topography
Learners construct a cross section diagram showing elevation changes on a "cookie island." Using a chocolate chip cookie for an island, they locate the highest point in centimeters on the cookie and create a scale in feet. After tracing...
Curated OER
Class of 2000 - Student Loans
Students determine how they will finance their postsecondary education. In this student loan lesson, students create spreadsheets that help them budget their first year of college. Students identify methods to fund the budgets and...
Curated OER
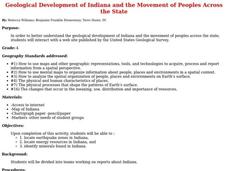
Geological Development of Indiana and the Movement of Peoples Across the State
Fourth graders examine the geological development of the state of Indiana. Using the internet, they interact with the United States Geological Survey. They identify earthquake zones and energy resources in the state. They work...
Curated OER
Geological Development of Indiana and the Movement of Peoples Across the State
Young scholars are introduced to the geological development of the state of Indiana. Using the internet, they visit the U.S. Geological Survey and locate the earthquake zones in the state. In groups, they locate and identify the energy...
Curated OER
The Gathering and Analysis of Data
Young mathematicians gather data on a topic, graph it in various forms, interpret the information, and write a summary of the data. They present their data and graphs to the class.
Curated OER
To Market to Market
Fourth graders research a product and participate in an integrated simulation of a free market economy where students will create, buy and sell a good or service. In completing this activity, 4th graders understand the concepts and...
Curated OER
And the Winner Is...
Third graders participate in an election project. They collect data to create a spreadsheet from which a graph is generated.
Curated OER
A Bird's Eye View of our 50 States
Third graders focus on state birds as they learned absolute location (latitude/longitude) of each state, as well as their relative location (bordering states).
Annenberg Foundation
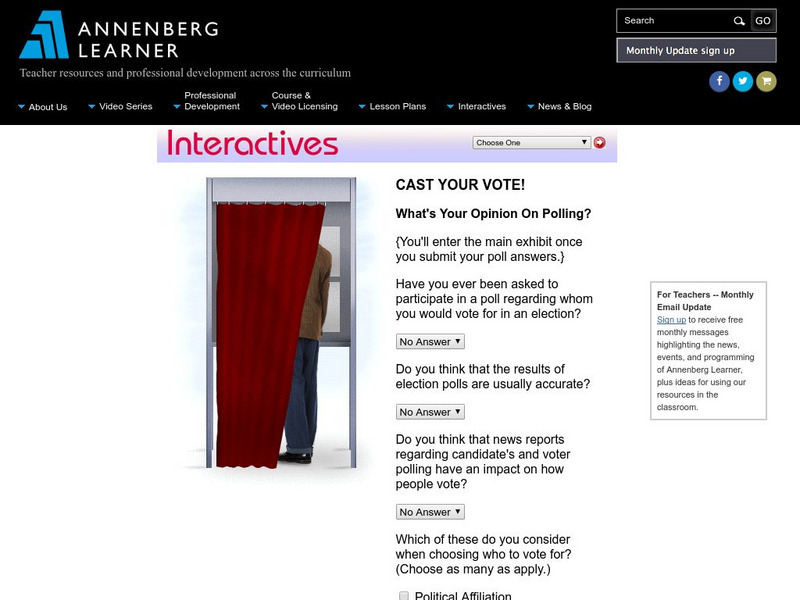
Annenberg Learner: Interactives: Cast Your Vote!
Upper elementary, middle, and high school students can use this exhibit to get an understanding of how polls and elections are conducted. The discussion includes random samples, margins of error, and other concepts related to statistics.


