EngageNY
Average Rate of Change
Learners consider the rate of filling a cone in the 23rd installment of this lesson series. They analyze the volume of the cone at various heights and discover the rate of filling is not constant. The lesson ends with a discussion of...
EngageNY
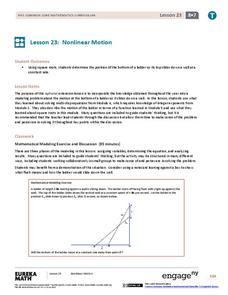
Nonlinear Motion
Investigate nonlinear motion through an analysis using the Pythagorean Theorem. Pupils combine their algebraic and geometric skills in the 24th lesson of this 25-part module. Using the Pythagorean Theorem, scholars collect data on the...
Scholastic
Calligraphy Minibook
Engage young learners in practicing their counting skills while teaching them about the Japanese writing system with this printable book. Using the included key that shows the kanji characters for the numbers 1-10, children count the...
Curated OER
The Business of Credit
Learn about credit ratings and how it plays a role in the function of small businesses. Learners use their knowledge of good and bad credit to role play and determine good credit vs. bad credit in the area of small businesses.
Curated OER
It's Your Future
Young scholars learn about productive resources along with their requirements, supply and demand, savings, investments and interest rates. In this supply and demand lesson, students create a career plan and personal budget of their own...
Curated OER
60-30-10
Learners use ratios and proportions to represent quantitative relationships as they investigate the concept of how percentages are used by designers. Students decorate the same room using three different percentages of colors.
Curated OER
Finance and Responsible Lending
Students learn the characteristics of economic systems through problem solving, communication and representation. For this financial lending lesson, students use math to solve problems dealing with the economy today, to work with their...
Curated OER
WHY DOES MONEY HAVE VALUE?
Students learn that money has value by examining the history, meaning of money. market structures and pricing. In this analysis lesson, students use exchange rates to find the cost of an item different currencies.
Curated OER
Elements of a Short Story
Students analyze elements of a short story by working together. In this literature lesson, students analyze short stories. They use the TI Navigator Application to write their findings.
We are Teachers
What Goes Up Must Come Down
From understanding stock market performance and return on investment to identifying the costs and benefits of credit and avoiding debt problems, this is an absolute must-have resource for financial planning and literacy.
Curated OER
Filling Empty Pockets: Borrowing, Loans, and Credit
Students examine credit components and how each works within our economy today. In this financial literacy lesson, students explore credit terms and make decisions based on real credit card offers that they find in their on line research.
Curated OER
Geometry Shapes Playground Safety
Students create a new playground design to present to elementary students during Playground safety week. They review basic geometry to use in observing and recording the equipment on a local playground. They research playground safety...
Curated OER
Would You Like to Become a Millionaire?
Young scholars answer questions written by other teams about literature in an attempt to become "millionaires." In small groups they write a motivational introduction to their teams selected books, publish their questions as a HyperCard...
Curated OER
What Can Scatterplots Tell Us?
Eighth graders use data from surveys conducted with parents, peers and themselves to create computer-generated scatterplots. They make inferences from their scatterplots.
Curated OER
How Fast Is Your Car?
Eighth graders discover the relationship between speed, distance, and time. They calculate speed and represent their data graphically. They, in groups, design a ramp for their matchbox car. The goal is to see who's ramp produces the...


