Teach Engineering
Concentrating on the Sun with PVs
Concentrate to determine the best reflector design. Pairs use the engineering design process to build a reflector to increase the current output of a photovotaic panel. Teams arrive at a final design and present it to the class along...
EngageNY
The Decimal Expansion of Some Irrational Numbers
Develop a definition of irrational numbers through an exploration of square roots. The 11th instructional activity in this series of 25 asks scholars to estimate the value of a square root. Learners observe as the estimation extends...
EngageNY
Comparing Irrational Numbers
Build on your classes' understanding of irrational numbers by comparing their values. The 13th lesson in the 25-part module has individuals estimate values of both perfect and non-perfect roots. They finish by graphing these numbers on a...
California Mathematics Project
Meteorology
See how estimation is essential to making temperature weather maps. Scholars use ratios and rates of change to estimate temperatures at locations where temperature readings have not been made. They connect this idea to linear functions.
EngageNY
Why Worry About Sampling Variability?
Are the means the same or not? Groups create samples from a bag of numbers and calculate the sample means. Using the sample means as an estimate for the population mean, scholars try to determine whether the difference is real or not.
EngageNY
Understanding Variability When Estimating a Population Proportion
Estimate the proportion in a population using sampling. The 20th installment in a series of 25 introduces how to determine proportions of categorical data within a population. Groups take random samples from a bag of cubes to determine...
EngageNY
Using Sample Data to Compare the Means of Two or More Populations
Determine whether there is a difference between two grades. Teams generate random samples of two grade levels of individuals. Groups use the mean absolute deviation to determine whether there is a meaningful difference between the...
McGraw Hill
Extra Solar Planets Interactive
Studying what you can't see can be challenging. Discover how scientists use indirect measurements to prove the existence of planets and estimate their sizes. The introduction explains the symbiotic movement of planets and stars during an...
EngageNY
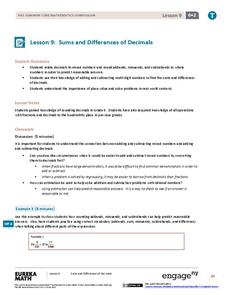
Sums and Differences of Decimals
Sometimes dealing with decimals is so much easier than dealing with fractions. The ninth lesson in a 21-part module has the class consider situations when it might be easier to add or subtract fractions by first converting to decimals....
NOAA
History's Thermometers
How is sea coral like a thermometer? Part three of a six-part series from NOAA describes how oceanographers can use coral growth to estimate water temperature over time. Life science pupils manipulate data to determine the age of corals...
Virginia Department of Education
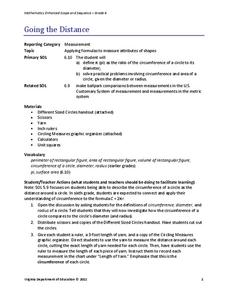
Going the Distance
Estimate the value of one of the most famous irrational numbers. The hands-on lesson plan instructs classmates to measure the circumference and diameters of circles using yarn. The ratio of these quantities defines pi.
CK-12 Foundation
Square Roots and Irrational Numbers: Estimating Radicals
Try out a resource using triangles to estimate radicals. An interactive app allows learners to approximate some irrational numbers involving square roots. They find the two consecutive numbers that an irrational number lies between by...
CK-12 Foundation
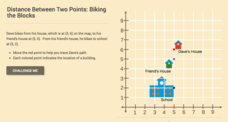
Distance Between Two Points: Biking the Blocks
Distance estimates would be easy if the world were a grid. Scholars work to determine the distance between two structures using a coordinate plane. As an introduction, the lesson focuses on vertical and horizontal distances.
Polar Trec
Ice Cores: Modeling Ice Sheets
Ice cores provide scientists with knowledge of historic melt layers, air temperatures, greenhouse gases, and climate stability. Scholars work in groups to build layers representing snow and ice over thousands of years. Then, groups...
CK-12 Foundation
Sampling Distribution of a Sample Mean: The Mean of the Average Ages
What does it mean to take the mean of the mean? An easy-to-use interactive has users adjust the mean ages of different samples. Finding the average of these sample means gives an estimate of the population mean.
CK-12 Foundation
Tangent Line Approximation: Estimating Square Roots
Estimating a square root is as easy as evaluating a linear equation. Using the derivative of the square root function, pupils calculate an estimation of square roots. Class members determine the equation of the tangent line at the value...
CK-12 Foundation
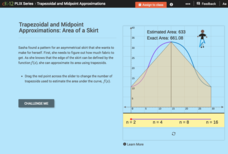
Trapezoidal and Midpoint Approximations: Area of a Skirt
When are trapezoids better than rectangles? Using trapezoids pupils approximate the area of fabric defined by a function. Just like with rectangles, learners realize the more trapezoids the more accurate the approximation. Scholars use...
CK-12 Foundation
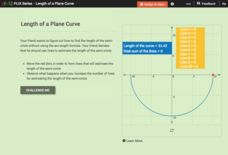
Length of a Plane Curve
Challenge your class to use straight lines when estimating the length of a curve. An engaging interactive allows individuals to place line segments one after another along the arc. Learners determine that the more lines used, the better...
DiscoverE
Friction in Action
There's no need to have friction among instructors regarding the resource. Pupils investigate how marbles and coins slide along different surfaces which gives them information to estimate coefficients of friction.
Teach Engineering
Messin' with Mixtures
Do you separate your trail mix before eating it? Then you've been separating mixtures your whole life! Scholars model a contaminated soil sample using trail mix and estimate the percentage of each component. They consider how to clean up...
101 Questions
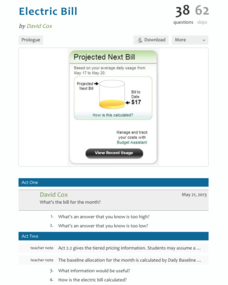
Electric Bill
A brilliant resource is at your disposal. Future consumers investigate and discuss an electric bill. Given only partial information, they estimate the monthly bill. They then consider how tiered pricing will affect the bill.
101 Questions
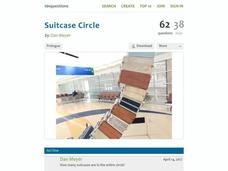
Suitcase Circle
Analyze patterns in a circular arrangement. After using a geometric construction to complete a circle, learners use proportional reasoning to make predictions. By determining the length of an arc built from suitcases, they estimate the...
101 Questions
Apple Mothership
Explore Apple's spaceship office building. Built in the shape of a circle, the office building offers a unique floor plan challenge. Young scholars use the dimensions of the building to estimate the square footage for each employee.
Nuffield Foundation
Monitoring Water Pollution with Invertebrate Indicator Species
Healthy invertebrates mean healthy ponds. An outdoor activity has scholars collect samples of invertebrates from local lakes or ponds. They identify and count different species and use the information to estimate the level of pollution...
Other popular searches
- Estimate Fractions
- Compatible Numbers to Estimate
- Estimate Angle Measurement
- Estimate and Measure Length
- Estimate Quotient
- Estimate the Sum
- Estimate Percent
- Estimate Measure Weight
- Estimate by Rounding
- Magnitude Estimates
- Estimate Numbers
- Estimate Fractions For


