Curated OER
City, County, Community
Young scholars explore issues and situations that make for a city and its local environments. In this local government lesson, students design maps, define issues and create brochures that illustrate their understandings of these...
Curated OER
Snail Car
Students design and create robotic cars using Legos and the Robolab program. They hold a "snail race" where the slowest car that can be determined to be actually moving is the winner.
Curated OER
Virtual Earthquake
Students visit a website that features online interactive geology and biology simulations. They observe and estimate the amplitude of the largest wave and transfer the information to a nomogram. Based on the nomogram students will...
Creative Educator
Dream Room Design
Using the Twist™ application, elementary schoolers design their dream room. They follow the prescribed steps to calculate width, length, perimeter, and surface area in order to create a 2-dimensional representation of their dream room...
Curated OER
Comparison of Snow Cover on Different Continents
Students use the Live Access Server (LAS) to form maps and a numerical text file of snow cover for each continent on a particular date and analyze the data for each map, corresponding text file to determine an estimate of snow cover for...
Delaware Math Cadre Elementary Committee
Operations and Algebraic Thinking
How to use the relationship between multiplication and division to solve math word problems is the focus of the lesson presented here. In it, fourth graders work in groups to solve problems posed by the teacher. Then, each group is given...
Alberta Learning
Area and Perimeter of Irregular Shapes
Evaluate young mathematicians' understanding of area and perimeter with this series of three assessment tasks. Challenging students to not only calculate the area and perimeter of irregular shapes, but to explain in writing their...
EngageNY
Using Sample Data to Compare the Means of Two or More Populations II
The 23rd segment in a series of 25 presents random samples from two populations to determine whether there is a difference. Groups determine whether they believe there is a difference between the two populations and later use an...
Curated OER
Rolling Number Sentences
Budding mathematicians investigate how to write number sentences using the Roll-the-Dice tool in "Kid Pix". They correlate the dots on the dice to numbers and then learn to use the addition and equal symbols to write number sentences....
Illustrative Mathematics
Eratosthenes and the Circumference of the Earth
The class gets to practice being a mathematician in ancient Greece, performing geometric application problems in the way of Eratosthenes. After following the steps of the great mathematicians, they then compare the (surprisingly...
International Technology Education Association
Sizing Up the Clouds
How much rain can that cloud make? Through a simulation, the class estimates the amount of candy rain contained in different cup clouds. After probing the clouds using different methods, class members adjust their estimates. Participants...
Curated OER
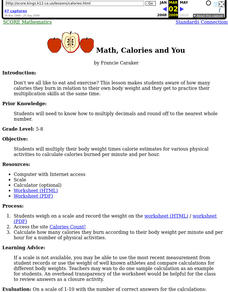
Math, Calories and You
Discover the connection between calories and weight. Pupils multiply their body weight times calorie estimates for various physical activities to calculate calories burned per minute and per hour. Worksheets a well as website links are...
Curated OER
Chemistry Day With Glitter Wands
First graders observe examples of the three states of matter and identify matter in each of the three states. They make glitter wands to remind them of the three states of matter: solid, liquid and gas. Pupils brainstorm and record...
Curated OER
Math Survey
This math worksheet requires self-assessment of personal feelings regarding mathematics. Beginner mathematicians rate themselves on various aspects of math as well as share what they feel to be their strengths and weaknesses in the...
Marine Institute
Water Pollution
Sixth graders investigate the various types of pollutants found in water and ways to help prevent water pollution. Through a hands-on experiment, students create samples of polluted water by mixing water with vegetable oil, dirt,...
Houston Area Calculus Teachers
Area and Volume
An AP calculus lesson begins with an activity to determine the volume of a solid using a cross-section. Next, learners review the ways to find the area between two curves , as well how to find the volume of a solid created...
Curated OER
Water Down the Drain
Did you know that leaky faucets waste $10 million worth of water? Conservationists perform an experiment and draw best-fit lines to explore how the US Geological Society determined this value.
Noyce Foundation
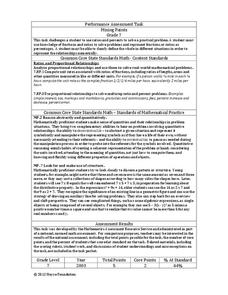
Mixing Paints
Let's paint the town equal parts yellow and violet, or simply brown. Pupils calculate the amount of blue and red paint needed to make six quarts of brown paint. Individuals then explain how they determined the percentage of the brown...
Mathematics Vision Project
Module 8: Probability
It's probably a good idea to use the unit. Young mathematicians learn about conditional probability using Venn diagrams, tree diagrams, and two-way tables. They also take into consideration independence and the addition rules.
Curated OER
Partial Products
Third graders study partial-products algorithms. In this math lesson, 3rd graders use an algorithm to find the product of factors. Students discuss the relationships between multiplication and division.
Curated OER
Estimation
Pupils estimate quantity, length, and area. Students practice making comparison estimations of different items and estimate whether or not the amount is greater or less than a certain amount. Pupils practice making estimations.
Curated OER
Arrange the Classroom (Part 1 of 3)
Fifth graders arrange the classroom using all the moveable objects and through the exploration of area and perimeter. They determine the area of the classroom, create and label model pieces of furniture using graph paper, and create a...
Curated OER
Shape Matters More!
Students investigate shapes as the area changes while the perimeter remains the same. Students demonstrate the shape/perimeter/area relationship using simulations and physical models.
Curated OER
Ocean Botttom Profile
Students interpret a graph of ocean depths and topographic features. This task assesses students' abilities to interpret figures, organize and represent data, apply knowledge of scale to a profile, and apply theoretical knowledge.


