Teach Engineering
Magnetic Materials
The design challenge: develop a method to separate steel from aluminum. The first lesson plan in an eight-part series introduces the class to the grand challenge of ciming up with a method to streamline a sorting process at a recycling...
Curated OER
Lost in Translation
Students reflect on the uses of mathematics in their daily lives and work in pairs to design brochures that make specific mathematical concepts clear and interesting to a popular audience.
Curated OER
Number Stories
Pupils write and solve various number stories. They solve number stories using one, two and three digit numbers. Students practice writing sentences using the following 6+1 traits, ideas and content, organization, word choice and...
Curated OER
Part Part Whole
First graders solve number sentences. In this problem solving lesson, 1st graders construct addition sentences using a part part whole mat. Students demonstrate problem solving strategies using cubes.
Curated OER
Sequencing
Second graders retell a story focusing on sequence. in this sequence instructional activity, 2nd graders read the story Carry Go Bring Come by Vyanne Samuels. They retell parts of the story and put them in the correct order.
Curated OER
Basic Sense
Fifth graders add fractions. After a class discussion on real life application of fractions, the teacher uses fractions strips to model adding fractions. In pairs, 5th graders model adding fractions by drawing diagrams. They justify...
Curated OER
Graphing Data
Students graph lines in a coordinate plane. In this geometry lesson, students graph lines on a coordinate plane, and identify the slope. They calculate the volume, area and perimeters of the shapes created on a coordinate plane.
Curated OER
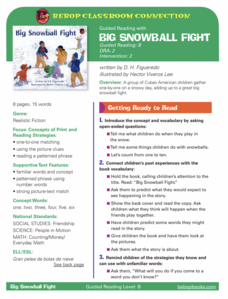
Big Snowball Fight
Students complete pre reading, writing, during reading, and interdisciplinary activities for the book Big Snowball Fight. For this reading lesson plan, students complete journal entries, answer short answer questions, have discussions,...
Curated OER
Estimating With Decimals
How can we estimate the answers when working with decimals? That's what the question is as the class reviews two-digit decimal addition. Have them estimate by rounding to a whole number either before or after they have completed their...
Curated OER
Parallel and Perpendicular Lines
Fourth graders create a dance with a partner that shows parallel and perpendicular lines. In this lines lesson plan, 4th graders create symmetrical designs and line pairs with their partner.
Curated OER
Learning to Add and Subtract
Young learners practice addition and subtraction to solve problems. They use a webquest application to model how to solve math problems using pictures, words and numbers, and also practice using multiplication and division.
Curated OER
Budgeting for the Future
Eighth graders determine the net amount of an income for a fictional job. They must determine their net worth minus standard deductions. Students must then determine their monthly budget including, groceries, credit, and rent.
Curated OER
Stressed and Strained
Students explore stress and strength in engineering design. In this engineering lesson, students become familiar with terminology associated with stress and strain on building material. They will have a class discuss about how their beam...
Curated OER
Fractions
Fourth graders use pattern blocks and fraction identification cards to create and identify fractions. In this fractions lesson plan, 4th graders identify fractions in a pizza, and make fractions with markers.
Curated OER
Lesson #10 Standard Measurement
Learners are introduced to units of measurement found on a ruler as well as what attributes make an object difficult or easier to measure with a ruler. The teacher has various objects placed around the room, and the youngsters practice...
Curated OER
Paper Folding to Make Cubes
Examine patterns of figures composed of six-squares and predict which of the twenty presented could be folded to make a cube. They then fold large-scale patterns of these figures to confirm their hunches.
Curated OER
Holiday Greeting Cards: A Graphing Activity
Students examine statistics about the popular type of greeting cards and create pie or bar chart using an online tool. They illustrate the sales statistics for the greeting cards before making the charts.
Curated OER
Probability using M & M's
Using M & M's candies, young statisticians predict the color distribution in a packet of candies and test their predictions against their group and the larger class. A review of converting between fractions, decimals, and percents...
Curated OER
What's in a Shape?
Students explore characteristics of shapes by making and using tangram sets. They discover how the tangram pieces are related to one another, and determine how many different combinations of the triangles, squares, and parallelograms in...
Curated OER
Usage and Interpretation of Graphs
Cooperative groups are formed for this graphing activity. Each group must construct a graph that represents how many eyelets (the holes for laces in shoes), are present in their group. A whole-class bar graph is eventually constructed...
Curated OER
Geometry Digital Blogging Books
Students observe geometric shapes in their everyday lives. In this middle school/high school mathematics lesson, students use their cell phone to record and publish their observations about the geometric shapes they encounter. Students...
Curated OER
Hibernating Hoopla
Students simulate hibernation with their stuffed animals. They predict the length of time of hibernation and type their math journal entries about sorting, graphing and draw pictures. They read bear hibernation stories.
Curated OER
How Much Water Do We Use In Our Homes?
Learners discover the amount of water used for everyday activities around their home in this lesson. They research the amount of water needed by accessing a provided internet link. They then graph the information they discovered and...
Curated OER
Against all Odds
Tenth graders appreciate the role of probability in understanding everyday situations. They Communicate a summary of financial projections in appropriate reports, tables, and graphs after creating a new game of chance.


