Teach Engineering
What a Drag!
Stop and drop what is in your hand! Pupils investigate how form effects drag in the 12th part of a 22-part unit on aviation. Groups create equally weighted objects and determine which one falls the fastest by collecting data.
American Statistical Association
A Sweet Task
Candy is always an effective motivator! A fun math activity uses M&M's and Skittles to explore two-way frequency tables and conditional probability. The candy can serve a dual purpose as manipulatives and experimental data.
Shodor Education Foundation
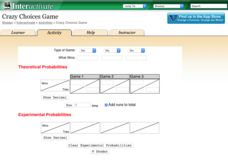
Crazy Choices Game
Wanna take a chance on which game is best? The resource provides three games of chance using multiple types of games. Games range from coin toss to cards. Choosing a type of game, pupils determine what wins and enter the theoretical...
Curated OER
Calculating Theoretical & Experimental Probability
Students explore the concept of experimental and theoretical probability. In this experimental and theoretical probability lesson, students collect data by conducting a survey of their classmates. Students compare their data and discuss...
Curated OER
Antlion Pit Building Investigation
Students design and perform an experiment related to comparing and contrasting antlion pits. Given a set of parameters, students select a hypothesis and perform observations on antlion pits. They record data and use this date to support...
Curated OER
Lahar Travel Time
Ninth graders analyze published geologic hazard maps of California and comprehend how to use the map's information to identify evidence of geologic events of the past and present and predict geologic changes in the future. They select...
Curated OER
Solar Kit Lesson #8 - Positioning Solar Panels II: Explorations with Stationary Panels
This lesson plan is preparation-intensive, but well worth the investment. You will construct five or six portable testing stations with which lab groups will gather data on the best position for collecting sunlight with a solar panel....
Pingry School
Synthesis of an Insoluble Ionic Salt: A Stoichiometry Experiment
Challenge young scientists to design their own experimental procedures. They write the procedure for properly preparing two grams of a water-insoluble ionic salt. To finish, they perform the experiment and collect data to prove their...
National Nanotechnology Infrastructure Network
The Effects of Gold and Silver Nanoparticles on Brine Shrimp: A Toxicology Study
Who doesn't love gold and silver? Brine shrimp, that's who! Learners conduct an experimental lesson plan to monitor the toxicity of gold and silver nanoparticles on brine shrimp. They synthesize solutions to expose the brine shrimp to...
Curated OER
Take a Chance on Probability
Connect ratios, probability, and combination outcomes with a challenging activity idea. It guides your learners through probability of an event as fractions or ratios, on a number line, and with correct vocabulary. The class will be...
Clarkson University
Understanding Energy (With a Pendulum)
Have you ever wanted to play with a giant pendulum? An experiment allows small groups to do just that. They gather data and make observations as they complete the included worksheet. The instructional activity lays out each instruction...
American Chemical Society
Different Substances React Differently
Looks don't tell the whole story. Young experimenters explore reactions with substances that look similar. They observe the reactions that take place when combined with baking soda and use indicators to conclude they react differently...
Curated OER
Probability and Expected Value
Students collect data and analyze it. In this statistics lesson, students make predictions using different outcomes of trials.
Curated OER
Handling Data: Coin Tossing Simulation
Students collect experimental data and record it on a frequency table. After accessing an Internet coin toss simulation site they discover that repetition of an experiment may result in different outcomes. They identify the mutually...
Curated OER
Where do Plants Get their Food?
In this where do plants get their food worksheet, students design an experiment that will disprove the idea that plants obtain their food from soil. Students will set up their experiment and design a data table that will record data over...
Curated OER
Probability and Statistics
Students are taught to search the internet for statistics concepts on sports. In this probability lesson, students collect data and use the calculator to graph and analyze their data. They graph and make predictions about sports using...
Curated OER
Designing the Experiment and Answering the Question
Students investigate scientific methods by analyzing an article from the Natural Inquirer. In this data analysis lesson plan, students read an article from the magazine and discuss at least 2 scientific methods that could be used to...
Curated OER
Which Number Will Finish First?
Students conduct probability experiments. in this number lesson, students use spinners and conduct probability experiments. They collect and organize data on talley sheets.
Statistics Education Web
Consuming Cola
Caffeine affects your heart rate — or does it? Learners study experimental design while conducting their own experiment. They collect heart rate data after drinking a caffeinated beverage, create a box plot, and draw conclusions. They...
Stats Monkey
Everything I Ever Needed to Learn about AP Statistics I Learned from a Bag of M and M's®
Candy is always a good motivator! Use this collection of M&M's® experiments to introduce statistics topics, including mean, standard deviation, nonlinear transformation, and many more. The use of a hands-on model with these AP...
Teach Engineering
Exploring Acceleration with an Android
Small groups use rubber bands to accelerate an Android device along a track of books. They collect the acceleration data and analyze it in order to determine the device's velocity.
Curated OER
Open Inquiry Using C. elegans
Ever wondered what motivates a roundworm? Introduce your biology class to C. elegans, a non-parasitic model organism that can help them understand behavioral stimuli. Paired pupils design an experiment to test the worm's reaction to...
American Statistical Association
Happy Birthday to . . . Two?
How many people do you need in a room before two likely share the same birthday? Scholars consider this puzzle by analyzing a set of data. They ponder how to divide the data and determine the proper size of a group for this event to...
University of Minnesota
Makes Me Sweat
Never let them see you sweat ... unless you can't help it! Scholars design an experiment to determine the effects of stress on the body. They monitor sweat production under different conditions and relate the response to the function of...


