Curated OER
Using Data from Sensors
Beginning with a discussion about using technology to collect data, this resource includes a video about the next Mars rover as an example. Young scientists are taught that filtering is necessary before collected data can be analyzed....
Curated OER
Energy Audit
Learners collect data about energy usage and use mathematical calculations to analyze their data. In this energy conservation and statistics math instructional activity, students survey their homes to complete an energy usage worksheet....
EngageNY
Estimating Probabilities by Collecting Data
Take a spin to determine experimental probability. Small groups spin a spinner and keep track of the sums of the spins and calculate the resulting probabilities. Pupils use simulated frequencies to practice finding other probabilities to...
American Statistical Association
How Fast Are You?
Quick! Snap up the instructional activity. Scholars first use an online app to collect data on reaction times by clicking a button when the color of a box changes. They then plot and analyze the data by considering measures of center,...
Curated OER
Science Skills and Experimental Design
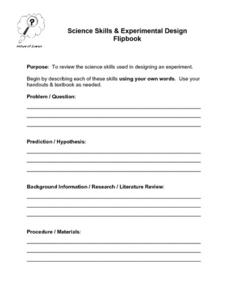
In this experimental design worksheet, students describe the different science skills required when designing an experiment. Then students create a flipbook with the information. This worksheet has 9 short answer questions.
EngageNY
Estimating Probability Distributions Empirically 1
What if you don't have theoretical probabilities with which to create probability distributions? The 11th installment of a 21-part module has scholars collecting data through a survey. The results of the survey provide empirical data to...
American Statistical Association
Colors Challenge!
Does writing the name of a color in a different colored ink affect one's ability to read it? Scholars design an experiment to answer this question. They collect the data, analyze the statistics, and draw a conclusion based on what they...
American Statistical Association
Bear Hugs
Scholars research arm span to determine who gives the best bear hugs. They use data from a national study to find the standard statistics for arm span. It includes mean, median, quartiles, spread, standard deviation, and more.
Curated OER
Analytical Problem Solving
Students explore about propagation of error in calculations using experimental data. They develop their weighing and pipetting techniques. Students explore the following terms: Standard deviation and relative standard deviatin. They...
Curated OER
Learning in Cockroaches
Learners make scientific observations. In this stimulus response lesson, students make observations and collect data to determine if cockroaches can learn. A secondary purpose of this lesson is to provide learners with the opportunity to...
NASA
Erosion and Landslides
A professional-quality PowerPoint, which includes links to footage of actual landslides in action, opens this moving activity. Viewers learn what conditions lead to erosion and land giving way. They simulate landslides with a variety of...
EngageNY
Drawing a Conclusion from an Experiment (part 1)
Challenge your classes to complete an experiment from beginning to end. Learners make their own hypotheses, collect and analyze their own data, and make their own conclusions. They are on their way to becoming statisticians!
Curated OER
Range, Cluster, Gap and Outliers
There are a number of activities here where learners collect and record data, as well as, activities where the likelihood of an event happening is calculated given the experimental probability. Young statisticians organize information...
Statistics Education Web
The Case of the Careless Zookeeper
Herbivores and carnivores just don't get along. Using a box of animal crackers, classes collect data about the injury status of herbivores and carnivores in the box. They complete the process of chi-square testing on the data from...
Virginia Department of Education
Heat Loss from a Fur-Insulated Animal
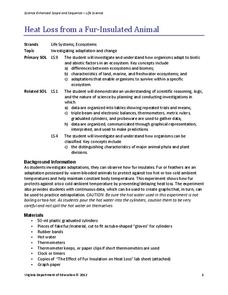
How do animals adapt to weather changes? Provide your class with the ability to understand adaptations and body temperature as they participate in this hands on experiment, using fake fur and hot water. Pupils collect data and analyze...
University of Georgia
Freezing and Melting of Water
Examine the behavior of energy as water freezes and melts. An engaging activity provides a hands-on experience to learners. Collaborative groups collect data and analyze the graphs of the temperature of water as it freezes and then...
Virginia Department of Education
Work and Power
Assist your class with correctly calculating the values for force, work, and power as they determine the amount various activities require. They gather data and participate in a group discussion to compare results upon conclusion of the...
University of California
Heating and Cooling of the Earth's Surface
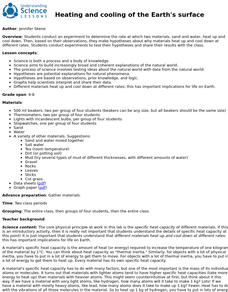
Scholars collect data from heating sand and water before forming testable hypotheses about why sand heats up faster. Afterward, they develop and run experiments to test their hypotheses.
Curated OER
Data and Scientific Graphs
Students conduct experiments and graph their data. In this statistics lesson, students collect data and graph it on a coordinate plane. They analyze the data looking for patterns and they discuss their findings with the class.
Curated OER
"Lucky Charms": Interpreting Data and Making Predictions
Seventh graders determine if a "lucky charm" will increase their chances of winning a game. Students calculate the experimental probability of each player in a game. They observe and collect data from each activity. Students compare the...
Curated OER
Probability Experiment Simulation: Design and Data Analysis Using a Graphing Calculator
Seventh graders simulate probability experiments. Using a graphing calculator, 7th graders design, conduct, and draw conclusions from simulations or probability experiments. Students construct frequency tables and compare the...
Curated OER
Beach Cleanup at a Local Beach
Students participate in an environmental clean-up activity. In this environmental lesson, students travel to a local beach. Working in small teams, students collect trash from the local beach. Returning to school, students sort the trash...
American Statistical Association
Don't Spill the Beans!
Become a bean counter. Pupils use a fun activity to design and execute an experiment to determine whether they can grab more beans with their dominant hand or non-dominant hand. They use the class data to create scatter plots and then...
Curated OER
Grade 5: Alphabet Frequency
Fifth graders collect and organize data from writing samples, use fractions and decimals to describe the experimental data, and use the experimental results to make predictions about the frequency of letter usage in the English language.


