Statistics Education Web
Consuming Cola
Caffeine affects your heart rate — or does it? Learners study experimental design while conducting their own experiment. They collect heart rate data after drinking a caffeinated beverage, create a box plot, and draw conclusions. They...
EngageNY
Ruling Out Chance (part 2)
Help your classes find the significance in this lesson! Learners analyze the probability of Diff values. They then determine if the difference is significant based on their probability of occurrence.
Curated OER
Probability and Expected Value
Students collect data and analyze it. In this statistics lesson, students make predictions using different outcomes of trials.
Curated OER
The M & M Function
In this M & M worksheet, students perform probability experiments. They collect and interpret data, identify the exponential function describing the data and create graphs from the collected information. This one-page worksheet...
Curated OER
Chaos
Students experiment with several chaotic simulation, they build a working definition of chaos. Students reinforce their knowledge of basic probability and percents. They are reminded of previous knowledge that is pertinent to this...
Curated OER
ng Data: Probability, What's in the bag?
Students use the language associated with probability to discuss events including those with equally likely outcome. They collect data from a simple experiment and record in a frequency table: estimate probabilities based on this data
Curated OER
Probability
Fourth graders predict future outcomes with an investigation of the mathematical principle of probability using spinners constructed by them. The spinner is a hands on application an they combine it with writing a ratio for the...
Curated OER
Probability
Fifth graders explore simple probability. Using a specified website, they play a "Fish Tank" game where they determine the chances of selecting a red fish from an aquarium. Students answer probability problems and convert fractions to...
Curated OER
Handling Data: Probability
Fourth graders find and justify probabilities and approximations. In this repeating experiment, 4th graders complete a worksheet after rolling die and tossing coins to determine outcomes.
College Board
2002 AP® Statistics Free-Response Questions Form B
Develop a deeper understanding of statistics. The six released free-response items from the 2002 AP® Statistics Form B involve several concepts that are currently in the regular statistics standards. Teachers see how AP® assessed the...
EngageNY
Experiments and the Role of Random Assignment
Time to experiment with mathematics! Learners study experimental design and how randomization applies. They emphasize the difference between random selection and random assignment and how both are important to the validation of the...
College Board
2003 AP® Statistics Free-Response Questions Form B
Update the statistics in your course using older AP® questions. The 2003 AP® Statistics free-response questions cover several of the concepts in the current statistics standards for all pupils. Items contain questions about determining...
Radford University
Corn and Popcorn
Have a popping good time. Using probability and statistics skills, learners determine which type of popcorn to buy based on the percentage of kernels popped. After analyzing corn and popcorn sales to make a prediction of future sales,...
College Board
2010 AP® Statistics Free-Response Questions
Familiarity with the AP® exam is highly beneficial for test-takers. Scholars use the 2010 AP® Statistics free-response questions familiarize themselves with the test content and format. Studies and experiments, linear regression,...
College Board
2005 AP® Statistics Free-Response Questions Form B
Here's another great way to learn from the past. Released free-response questions provide a look into how concepts measured on the 2005 AP® Statistics Exam on Form B. Teachers and pupils review questions that cover concepts such as...
Curated OER
Marble Mania
Students explore the concept of probability. In this probability lesson, students develop an understanding of probability by pulling marbles out of a bag and recording the data. Students use the recording sheet to discuss the results of...
Curated OER
Theoretically Speaking
Students define probability. They determine outcome from a given situation based on simple probability. Students create experimental data using a coin and a number cube. They write how theoretical and experimental probability are different.
Curated OER
What are the Chances: A Game of Chance!
Sixth graders experiment with dice, playing cards, pennies and computer-generated simulations to calculate probability. They use compiled data to make predictions.
Curated OER
Let's Take a Chance!
Students investigate probability and the chance of an even happening. In this algebra lesson, students incorporate their knowledge of probability to solve problems and relate it to the real world. They learn to make decisions based on data.
Curated OER
Math: Heads or Tails
Seventh graders discover the difference between theoretical and experimental probabilities by designing their own problems and testing them. After conducting their own coin toss trial, they compare their results with an Internet...
Curated OER
Handling Data: Coin Tossing Simulation
Students collect experimental data and record it on a frequency table. After accessing an Internet coin toss simulation site they discover that repetition of an experiment may result in different outcomes. They identify the mutually...
Shodor Education Foundation
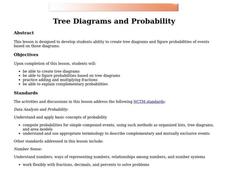
Tree Diagrams and Probability
Aspiring statisticians create tree diagrams and figure probabilities of events based on those diagrams. They practice adding and multiplying fractions and explain complementary probabilities. Students use computers activities to make...
Curated OER
Probability and Statistics
Students are taught to search the internet for statistics concepts on sports. In this probability lesson, students collect data and use the calculator to graph and analyze their data. They graph and make predictions about sports using...
Curated OER
50:50 Chances
Third graders reinforce the probability of gender by uising a coin toss, as they continue to search for the answers to genetics questions by using mathematical expectations of probability.


