EngageNY
Analyzing a Data Set
Through discussions and journaling, classmates determine methods to associate types of functions with data presented in a table. Small groups then work with examples and exercises to refine their methods and find functions that work...
Project Maths
Introduction to e
First there was pi and now there's e. A discovery-based lesson helps learners find a pattern in compound interest as the compounding period changes. Their investigation results in the discovery of the number e. The lesson is the first in...
EngageNY
Relationships Between Two Numerical Variables
Working in small groups and in pairs, classmates build an understanding of what types of relationships can be used to model individual scatter plots. The nonlinear scatter plots in this lesson on relationships between two numerical...
West Contra Costa Unified School District
Introduction to Logarithms
Build on pupils' understanding of inverse functions by connecting logarithmic functions to exponential functions. This activity allows individuals to see graphically the inverse relationship between an exponential and logarithmic...
Alabama Learning Exchange
Bloodstain Pattern Doesn't Lie......
An interesting instructional activity on hypothesizing about the diameter of a drop of blood that is splattered. To test their theories, learners work in groups to make blood droplets splatter from different heights. They use graphed...
Curated OER
Population Biology Case Study
Students are focused on the big question: What makes a population grow and how could that growth stop? They use these concepts to help answer the big question: carry capacity, density dependent v. density, independent factors, predation...
Curated OER
Population Biology - Biology Teaching Thesis
Students explore the effects of different density-dependent and density-independent factors on population growth. They explore how the interactions of organisms can affect population growth. Students explore the pattern of population...
Curated OER
Determining the Relationship Between pH and Hydrogen Ions with Microcomputer Based Lab (MBL) and/or Calculator Based Lab (CBL) Equipment
Learners find the relationship between the variables based on experimental data. They determine mathematical relationship between pH and the amount of hydrogen Ions in solution.
Curated OER
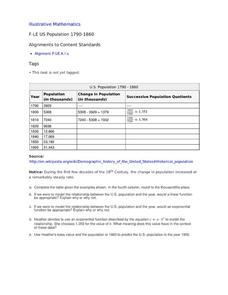
US Population 1790-1860
Your young population scientists analyze a table of values, write a model to represent the real life data, finish the table of data and predict future populations in a collaborative, real-life activity.
EngageNY
Modeling from a Sequence
Building upon previous knowledge of sequences, collaborative pairs analyze sequences to determine the type and to make predictions of future terms. The exercises build through arithmetic and geometric sequences before introducing...
CK-12 Foundation
Logarithms: Logarithm Triangle
Study logarithmic properties using a triangle. A clever manipulative shows how a triangle can represent the three parts of a logarithmic or exponential equation. Pupils review the concept and then answer guiding questions to further...
Curated OER
Investigation - Looking For Triangles
Seventh graders investigate a series of triangles, looking for patterns and generalizing what they have found. They analyze the pattern data and organize it into a table and graph. Students identify the relationship and discover the rule...
Achieve
Spread of Disease
Viruses can spread like wildfire, and mathematics can model the speed of infection. Given a function, scholars analyze it to describe the spread of a disease within a stadium. Learners find the initial number infected and the maximum...
EngageNY
Analyzing a Graph
Collaborative groups utilize their knowledge of parent functions and transformations to determine the equations associated with graphs. The graph is then related to the scenario it represents.
Mathematics Assessment Project
College and Career Readiness Mathematics Test A2
A six-page evaluation covers material included in algebra, geometry, and algebra II. Applied word problems are mixed in with short answer questions. It also provides questions on mathematical reasoning.
Rice University
Precalculus
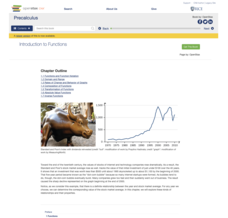
Take a step beyond Algebra 2. Learners use the eBook to learn concepts from the typical Precalculus course. Content starts off with a short review of functions in general and moves on to the basic functions, finishing up with more...
Curated OER
Bacteria and Illness
Students research information on bacterium and their relationship to food borne diseases. In this science lesson plan, students complete internet research to construct and analyze the growth cure of common bacterium...
Curated OER
What is Log?
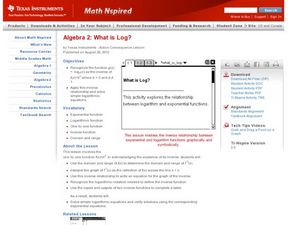
Young mathematicians differentiate between logs and natural logs in this algebra lesson. They solve functions and logarithmic functions. Learners also graph and rewrite the exponential and log functions.
Curated OER
Modeling Natural Disaster with Mathematical Functions
Ninth graders investigate the functional relationship of different environmental phenomena. In this math lesson, 9th graders create models of various natural disasters. They use logarithmic and exponential functions to interpret...
Curated OER
Why Are Hot Things Red?
In this radiation and temperature worksheet, students use 2 methods to derive the Wein Displacement law that shows the relationship between the temperature of a body to the frequency where the Planck curve's value is at its maximum....
Curated OER
Analyzinf Equations Through Slope and Y intercept
Students solve equations representing exponential functions. In this algebra lesson, students interpret their equations by analyzing the slope and y intercept. They find the slope using the slope formula.
West Contra Costa Unified School District
Introduction to Inverse Functions
Ready to share the beauty of the inverse function with your classes? This algebra II lesson plan guides the discovery of an inverse function through a numerical, graphical, and an algebraic approach. Connections are made between the...
Inside Mathematics
Population
Population density, it is not all that it is plotted to be. Pupils analyze a scatter plot of population versus area for some of the states in the US. The class members respond to eight questions about the graph, specific points and...
Curated OER
What "Ohm's" You?
Young scholars use the CBL and voltage probe to observe electricity. In this algebra activity, students use the TI calculator with the CBL to explore Ohm's Law. They discuss exponential equations and how it relates to Ohm's Law.


