Curated OER
Exploring Functions and Their Derivatives
Students explore and derive functions. In this calculus lesson, students graphs a function and find the derivative of each function as they compare exponential graphs. They relate and compare each function to its derivative.
Curated OER
"Bats on Parade" by Kathy Appelt
Students examine numbers and try to find a pattern in their relationship. They write an algebraic expression for the nth term.
Curated OER
Properties of Fractals
Students build a working definition of regular fractal, look carefully at the concepts of dimension and scale, and are introduced to logarithms. They solve simple exponential equations for the exponent both by trial and error and using...
Curated OER
Properties of Fractals
Students build a working definition of a regular fractal, they measure the concepts of dimensions and scale, they explore the concept of a logarithm and they attempt to solve simple exponential equations for the exponent both by trial...
Institute of Electrical and Electronics Engineers
Get Connected with Ohm's Law
Ideal for your electricity unit, especially with middle schoolers, this lesson plan gets engineers using multimeters in electrical circuits to explore the relationships among voltage, current, and resistance. Older learners may even plot...
Inside Mathematics
Sorting Functions
Graph A goes with equation C, but table B. The short assessment task requires class members to match graphs with their corresponding tables, equations, and verbalized rules. Pupils then provide explanations on the process they used to...
Mathematics Vision Project
Module 3: Polynomial Functions
An informative module highlights eight polynomial concepts. Learners work with polynomial functions, expressions, and equations through graphing, simplifying, and solving.
Mathematics Vision Project
Module 2: Logarithmic Functions
Build a solid understanding of logarithmic functions and equations. Five lessons in the module begin by developing the concept of a logarithm. The next lessons address graphing logarithmic functions, logarithmic properties, and solving...
Curated OER
Real-World Linear Programming
Explore linear programming on a website game. Partners solve a real-world problem by setting up an objective function and a linear inequality. They graph their results on chart paper and also using a calculator before presenting their...
Alabama Learning Exchange
There's Gold in Them There Hills
Need to build a laser fence on Mars? In this cute maximizing-area lesson, young explorers pretend to be prospectors on Mars and must determine the best way to use 20 meters of fencing in order to maximize their area. In addition,...
Curated OER
Peter's Third String
Explore the solution to a word problem involving area and perimeter. Learners read and discuss how to approach the problem. In small groups, they determine the maximum area of a rectangle with a given perimeter using a piece of string....
Curated OER
Reading Graphs
Working independently or in teams, your class practices connecting graphs, formulas and words. This lesson includes a guided discussion about distance vs. time graphs and looking at how velocity changes over time.
Curated OER
Math Handbook: Calculus
If only there was a reference that listed all the formulas covered in calculus. Luckily, there is. This comprehensive 197-page handbook provides formulas and explanations for all topics in AP Calculus or in a standard college calculus...
Illustrative Mathematics
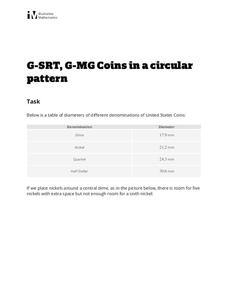
Coins in a Circular Pattern
What starts as a basic question of division and remainders quickly turns abstract in this question of related ratios and radii. The class works to surround a central coin with coins of the same and different values, then develops a...
EngageNY
Relationships Between Two Numerical Variables
Is there another way to view whether the data is linear or not? Class members work alone and in pairs to create scatter plots in order to determine whether there is a linear pattern or not. The exit ticket provides a quick way to...
Inside Mathematics
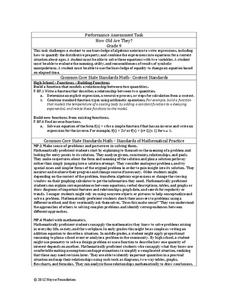
How Old Are They?
Here is a (great) lesson on using parentheses! The task requires the expression of ages using algebraic expressions, including the distributive property. Pupils use their expressions to determine the individual ages.
Howard County Schools
Planning for Prom
Make the most of your prom—with math! Pupils write and use a quadratic model to determine the optimal price of prom tickets. After determining the costs associated with the event, learners use a graph to analyze the break even point(s).
EngageNY
Polynomial, Rational, and Radical Relationships
This assessment pair goes way beyond simple graphing, factoring and solving polynomial equations, really forcing learners to investigate the math ideas behind the calculations. Short and to-the-point questions build on one another,...
Achieve
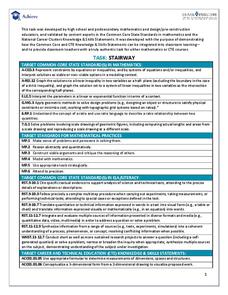
Stairway
It's the stairway to learning! Scholars research all aspects of building a staircase. Using information from building codes, they write and graph a system of inequalities to analyze the constraints. The completed project is a scale model...
EngageNY
Building Logarithmic Tables
Thank goodness we have calculators to compute logarithms. Pupils use calculators to create logarithmic tables to estimate values and use these tables to discover patterns (properties). The second half of the lesson has scholars use given...
EngageNY
The Graph of the Natural Logarithm Function
If two is company and three's a crowd, then what's e? Scholars observe how changes in the base affect the graph of a logarithmic function. They then graph the natural logarithm function and learn that all logarithmic functions can be...
EngageNY
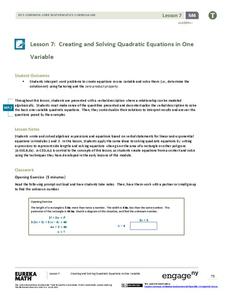
Creating and Solving Quadratic Equations in One Variable
Give your classes practice at modeling using quadratic models with a resource that uses area and integer problems to allow individuals to create second degree polynomials. Young mathematicians solve equations using factoring and then...
Inside Mathematics
Snakes
Get a line on the snakes. The assessment task requires the class to determine the species of unknown snakes based upon collected data. Individuals analyze two scatter plots and determine the most likely species for five...
West Contra Costa Unified School District
Point-Slope Application Problems
Create a linear equation for a problem when the intercept information is not given. The two-day lesson introduces the class to the point-slope form, which can be used for problems when the initial conditions are not provided. Pupils...


