University of Chicago
Using Artifacts for Clues About Identity
Learn about the ancient Near East through a close examination of ancient artifacts. Lead your class into analysis by first observing an artifact as a class. Pupils can then work in pairs to analyze the other artifacts and compile a list...
Canadian Museum of Civilization Corporation
Artifacts Tell Stories: Creating a First World War Museum in the Classroom
Although designed for the Canadian War Museum, the concept here is a solid one. Class members select an artifact from the First World War, examine it, research it, and craft an explanative label that they attach to their picture and post...
It's About Time
Taking a Ride on a Lithospheric Plate
Assist your pupils and broaden their horizons with several activities that determine the exact positioning of various communities over the globe. Pupils use data from the Global Positioning System to determine the position and rate of...
EngageNY
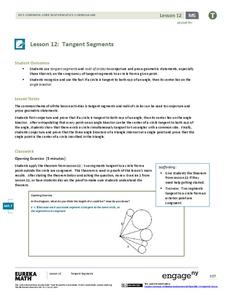
Tangent Segments
What's so special about tangents? Learners first explore how if a circle is tangent to both rays of an angle, then its center is on the angle bisector. They then complete a set of exercises designed to explore further properties and...
Virginia Department of Education
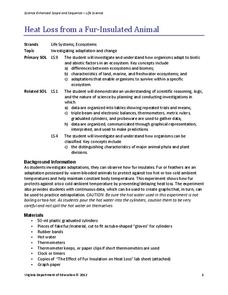
Heat Loss from a Fur-Insulated Animal
How do animals adapt to weather changes? Provide your class with the ability to understand adaptations and body temperature as they participate in this hands on experiment, using fake fur and hot water. Pupils collect data and...
Space Awareness
Valleys Deep and Mountains High
Sometimes the best view is from the farthest distance. Satellite imaging makes it possible to create altitude maps from far above the earth. A three-part activity has your young scientists play the role of the satellite and then use...
Howard Hughes Medical Institute
Patterns in the Distribution of Lactase Persistence
We all drink milk as babies, so why can't we all drink it as adults? Examine the trend in lactase production on the world-wide scale as science scholars analyze and interpret data. Groups create pie charts from the data, place them on a...
Kenan Fellows
How Does an Unhealthy Diet Influence our Health and Well-Being?
You are what you eat, or so they say! After surveying family and friends on a week of eating habits, learners analyze the data for patterns. They compare different variables such as fats and cost, fats and calories, or fats and LDLs.
Curated OER
Properties of Matter
Ninth graders explore the molecular structure of matter and how it can affect the physical characteristics of a specific material. They demonstrate that isotopes of an element have different masses. Students demonstrate that the rates of...
Curated OER
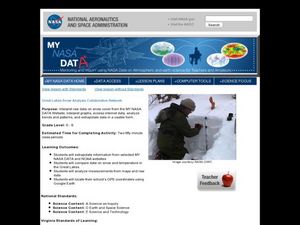
Great Lakes Snow Analysis Collaborative Network
Young scholars interpret data on snow cover and analyze trend patterns. In this snow lesson students compare data and locate their school's GPS coordinates.
Curated OER
Investigating Velocity Effects at Takeoff
Students use, with increasing confidence, problem-solving approaches to investigate and explain mathematical content. They make and test conjectures. They use tables and graphs as tools to interpret expressions, equations, and inequalities.
Curated OER
El Fútbol Femenino en España
Students use a worksheet to help focus their research on Spain's national women's soccer league. They access primary sources in Spanish and write a journalistic article using their findings.
Curated OER
Sea Changes: A New England Industry
Students conduct research in order to use primary and secondary sources. They interpret and analyze information from textbooks and nonfiction books for young adults, as well as reference materials, audio and media presentations, oral...
Curated OER
A Good Man is Hard to Find
Young scholars, in groups, read and analyze the short story, A Good Man is Hard to Find, by Flannery O'Connor. They present their findings tot he rest of the class and then connect the various themes discussed to outside material, events...
Curated OER
Count on Me
Fourth graders use inductive reasoning to find algebraic patterns in geometric figures. They use technology (i.e., calculators, computers) and manipulatives to discover number patterns involving geometric concepts. They solve concrete...
Curated OER
A Special Relationship
Students discover the relationships of the lengths of the sides of right triangles and right triangles using a series of drawings on dot paper. They investigate and solve problems of standard (customary and metric units) and non-standard...
Curated OER
Data
Students collect data from an experiment they perform. For this data lesson, students use multiple representations to solve practical problems; describe advantages and disadvantages of the use of each representation. Then, they evaluate...
Appalachian State University
Science Fiction - Genre
Unsuspecting George McFlys are presented into the craft workings of the science fiction genre of literature. Speculations are developed through teacher-led dialogs about how science fiction impacts science, technology, and comments on...
Curated OER
Texting and Grades II
Given the least squares regression line, interpret the slope and intercept in the context of the relationship between texting and GPA. Although this task is short and looks simple, some subtle points can be brought to light in a...
Curated OER
VARVES: Dating Sedimentary Strata: Geology, Paleontological Patterns
Learners count the number of varves (annual layers of sediment) in shale billets, taken from the Green River Formation in Wyoming. The count is then extended to reflect the entire 260 meters of sediments where the billets originated.
Curated OER
Frosty the Snowman Meets His Demise: An Analogy to Carbon Dating
Students read and discuss an article about carbon dating, then participate in a hands-on lab to discover how carbon dating works. Students also write a letter to a friend explaining the process, and how archeologists use the process to...
Curated OER
A Picture's Worth a Thousand Words
Students analyze the numbers of male vs female administrators and teachers from their school. In this gender equality lesson plan, students use school yearbooks from the 1950's threw present to count how many male vs. female teachers,...
Curated OER
Scientific Sampling
Students take a sample of fish and try to determine how many fish are in the sea. In this scientific sampling lesson, students explore the way scientists measure large areas of samples. Students record the distribution in a quadrant.
Curated OER
Lesson 11: Printed Materials (Ads and Broadsides) 1780-1820
Young scholars use primary resources (gazettes, broadsides, advertisements) to consider life at the turn of the 18th century in Deerfield, Massachusetts. They infer observations about life in the nascent United States.


