Curated OER
Extraordinary Extrapolation
Students study how scientists have estimated the maximum height to which trees can grow, and assess the reliability of interpolation and extrapolation techniques by making predictions with particular data sets and analyzing accuracy of...
Curated OER
Shaquille O'Neal Hand/Foot Span
Shaquille O'Neal has huge hands and feet, and learners will use those two measurements to practice collecting and extrapolating data using ratios. They record the measurement of foot and hand span of several of their classmates, then...
Curated OER
Using Extrapolations
In this using extrapolations learning exercise, 6th graders use data analysis to answer nine questions about data prediction and extrapolation.
Curated OER
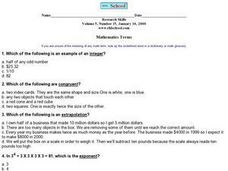
Math Terms- Congruent, Integer, Extrapolation, Exponent
In this math terms activity, students answer 4 multiple choice questions about the meaning of congruent, extrapolation, exponents, and integers.
Texas Instruments
Math TODAY for TI-Navigator System - Is Leisure Time Really Shrinking?
High schoolers organize data from the USA TODAY Snapshot, "Is leisure time really shrinking?" into two scatter plots and determine the quadratic model for each scatter plot. They determine if these graphs intersect and learn the concept...
Curated OER
Shaquille O'Neal Hand & Foot Span
If Shaquille O'Neal wears a size-20 shoe, how big are his hands? Learners will use the average ratios of foot length to hand span to calculate the hand span of Shaq, but first, they have to collect the data! They will...
Curated OER
Mathematics: A Picture's Worth a Thousand Words
Learners examine school yearbooks from 1950 to the present. They count the number of male and female teachers and administrators. They compile date and extrapolate changes in job trends.
Curated OER
Around the Clock
Students discover the relationship between the circumference of a circle and its diameter. They find the length of an arc of a circle.Students use estimation strategies in real-world applications to predict results (i.e., interpolation...
Curated OER
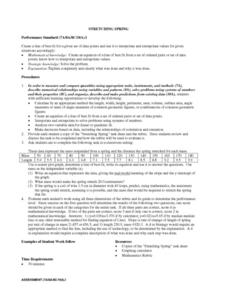
STRETCHING SPRING
Students calculate the length, width, height, perimeter, area, volume, surface area, angle measures or sums of angle measures of common geometric figures. They create an equation of a line of best fit from a set of ordered pairs or...
Curated OER
Numerical Analysis: Polynomial Interpolation
In this polynomial worksheet, students identify the interpolated and extrapolated value of given equations. This four-page worksheet contains approximately ten problems. Explanations and examples are provided.
Curated OER
Interpreting Graphs
Students investigate graphs. In this graphing lesson, students create a graph regarding the population of California. Students extrapolate answers concerning the data set.
Curated OER
RCX Car Line Graph
Pupils develop a line graph based on distances that an RCX car drives in specified amounts of time. They then are given a specific amount of time for the car to drive and be asked to extrapolate the car's distance from the graph.
Shodor Education Foundation
Playing with Probability
Review basic probability concepts with your class using different-colored marbles in a bag. Then pair up learners and have them play a cool online interactive game in which they race miniature cars using the roll of a die or...
PBS
From Patterns of Input and Output to Algebraic Equations
Watch video clips titled, "Frog Hops Part I" and "Frog Hops Part II," then discuss patterns demonstrated in the videos. Learners will complete an algebraic expressions and equations handout and discuss the answers. They will be able to...
Curated OER
Math Prefixes
Pupils use a dictionary to gather appropriate information for writing simple definitions. They recognize prefixes that relate to numbers, such as mono-, bi-, and tri-. Pupils use their creative abilities to extrapolate new words to...
Curated OER
How Alike Are We?
Fourth graders find the range, mode, median, and mean for each of the data sets (height and shoe size). They discuss which measure of central tendency for each data set best represents the class and why. Students graph the shoe size and...
Curated OER
Fire Wars
Your class can practice collecting and analyzing data. They extrapolate information and derive data from fire season statistics. They also choose the most appropriate format to display collected data.
Curated OER
Dating Practices
Students interpolate, extrapolate, and make predictions from given information. They present results and conclusions from given data using basic statistics. Pupils create a survey from a critical question and decide which sampling...
Curated OER
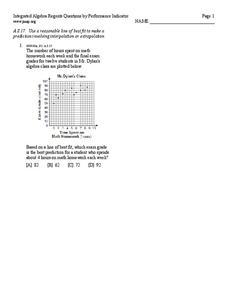
Line of best fit
In this Algebra I/Algebra II worksheet, students determine the line of best fit for a scatter plot and use the information to make predictions involving interpolation or extrapolation. The one page worksheet contains one multiple...
Curated OER
Using the Balance
Learners determine the mass of various objects. In this integrated math and science lesson, students use an arm balance to compare a known object to a combination of washers with a fixed weight. Learners record data, construct a bar...
Curated OER
Volumes of Solids
For this volume worksheet, students observe diagrams and extrapolate the correct items to plug into a formula for volume. They find the volume of triangular prisms, cylinders, cones, rectangular prisms, and rectangular pyramids. Four...
Curated OER
Graph a Situation by Making a Table
Students graph scenarios values by making a table. In this algebra lesson, students rewrite word problems using algebraic symbols. They make a table of the data, make a graph and analyze the data to extrapolate.
Curated OER
More graphing situations by making a table
Students make a table and graph plotting points. In this algebra lesson plan, students graph linear equations on a coordinate plane. They calculate the rate of change and analyze the graph for extrapolation.
Curated OER
Linear Patterns in Data
Eighth graders extend their learning of graphing linear equations and are introduced to connecting patterns in tables and graphs to represent algebraic representations. They then determine patterns and extrapolate information from these...


